2019
This was my first weather balloon project, and in fact, also my first electronics project. Without doing this during my A-levels, I’m not sure that I would have decided to study Electrical and Electronic Engineering at university, as at the time, I was leaning more to studying something like Physics. This project really kickstarted my passion for electronics, and it all started from my desire to circumvent dissertation writing…
When I was 16, and in my first year of A-levels, I had to think of what to do for my EPQ (Extended Project Qualification). This program is available in the UK as an additional qualification and allows students to explore areas of interest in depth. At my sixth form, it was a compulsory part of the programme. Typically, the result of the project is an essay, talking about your chosen subject area, how you researched it, and some conclusion to a question at the end. However, you can instead complete a more practical project if you wish, and instead produce an “artefact” at the end. This was the route I went down. My project was titled “Using a High Altitude Balloon to gather Environmental Data and Photograph the Earth”. In the end, I still had to write a long report about how I conducted my project and its results anyway!
I received a great deal of help on this project from the wonderful people from the UK High Altitude Society (UKHAS), and would like to thank Steve Randall of Random Engineering in particular, for his help during the launch.


Here area some links to jump to certain parts of the project:
Introduction
Let’s start with the basics. How do weather balloon flights work? Beyond being familiar with helium-filled party balloons, I had pretty much no clue at the start of the project. The earth’s atmosphere is composed of a mixture of gases, mainly nitrogen and oxygen. The density of the atmosphere is 1.225kg/m3 at sea level. Lighter-than-air gases, such as helium and hydrogen, have densities of around 0.17kg/m3 and 0.08kg/m3 respectively. Filling a balloon with one of these gases will mean that the buoyant force on the balloon will be greater than its mass, and so it will ascend.
Archimedes’ discovery of the principle of buoyancy provides an explanation for why balloons rise in the atmosphere. The buoyant force arises from the pressure gradient in the fluid surrounding a submerged object. On earth, gravity produces this pressure gradient, causing air at lower altitudes to have higher pressure than air at higher altitudes. Examining the force applied to the balloon reveals that horizontal components cancel out, leaving only vertical components. As the force applied is proportional to fluid pressure, the force applied at the top of the balloon is less than that applied at the bottom, creating a net buoyant force. All objects in the atmosphere experience this buoyant force, including humans. Without it, we would weigh approximately 0.1kg more. My preferred demonstration of pressure gradient buoyancy is the unintuitive response of helium balloons to lateral acceleration when confined in an enclosed space, such as a car.
If an object’s weight is less than the buoyant force acting on it, it will rise. This is precisely what happens to a weather balloon, which ascends at an approximate rate of 5m/s (18km/h). By attaching a payload to the balloon, we can lift it as well. As the balloon rises, atmospheric pressure decreases, causing the balloon to expand. Once it reaches its maximum altitude, typically around 30-40km, the balloon can no longer expand and ruptures. The payload then falls back to earth, using a parachute to slow its descent.
Cameras
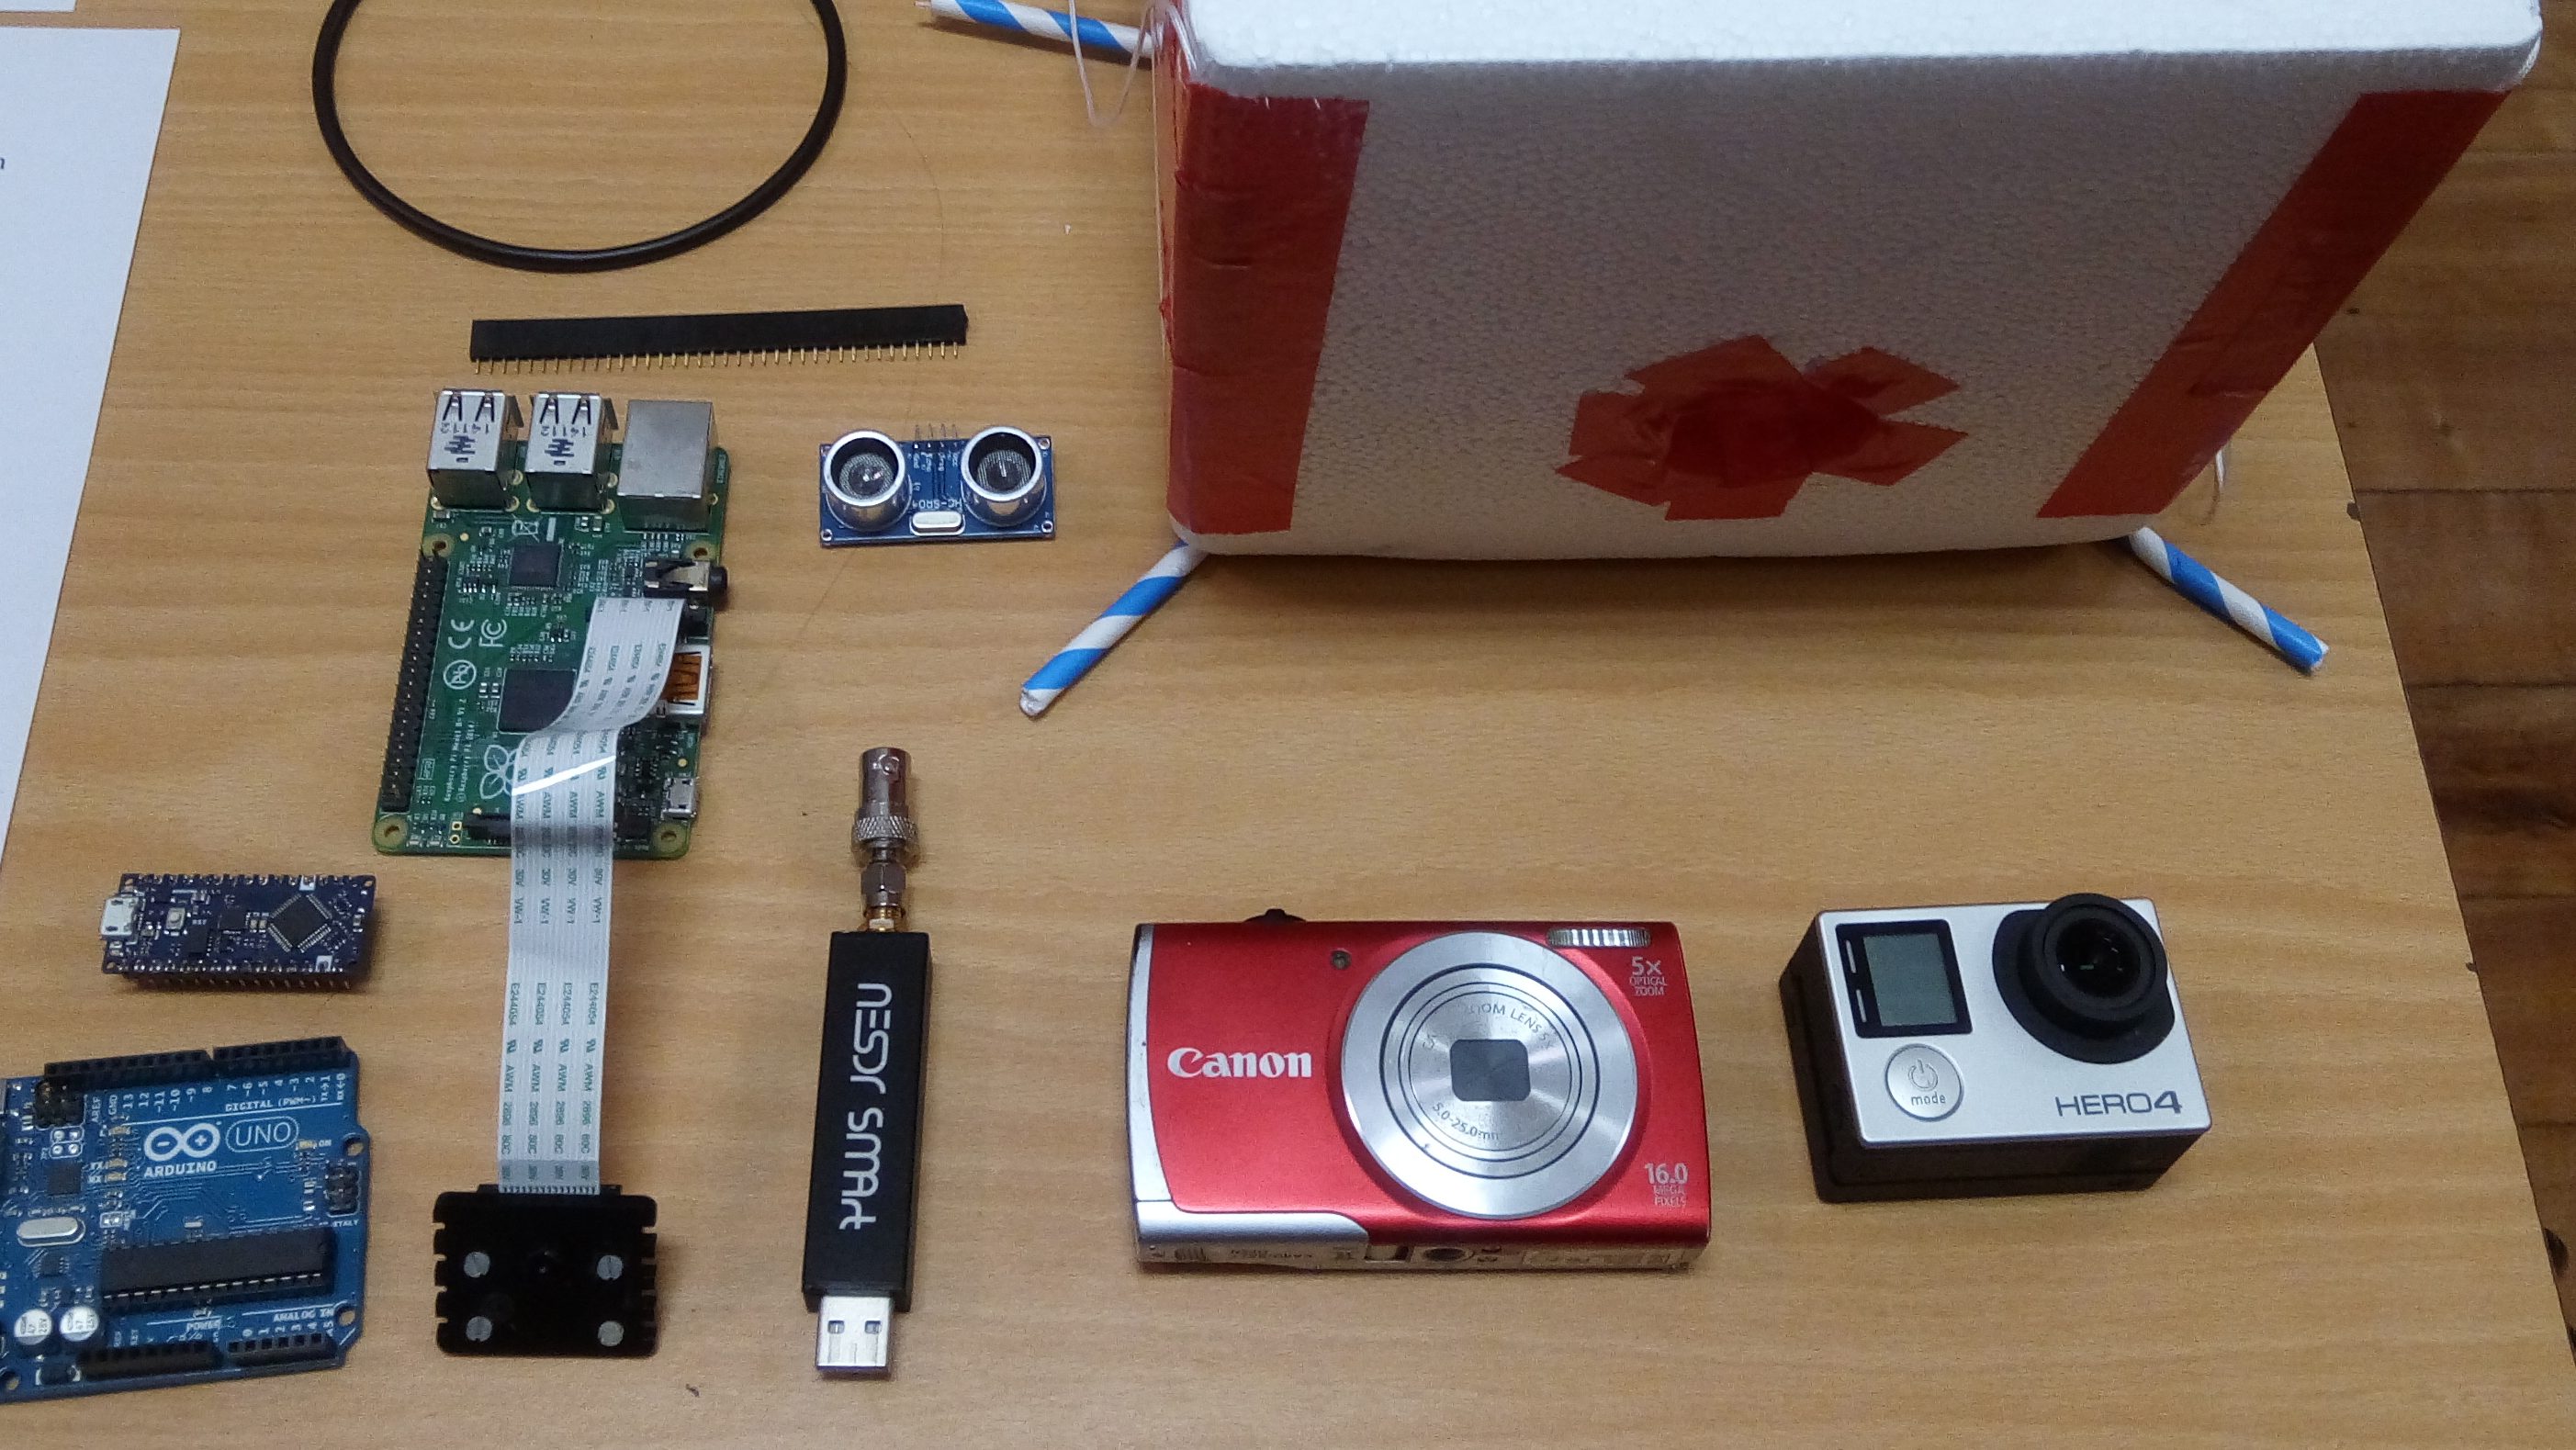
Obviously I wanted to capture images of the earth from near-space! To do this, I decided to put two cameras inside my payload. The first was my friend Jack’s GoPro Hero 4. He graciously lent it to me (I assured him I would buy a replacement if I lost it), and I bought an extra battery attachment that would allow it to record video for longer. This was a rather simple setup, I could simply start the video, and then launch the balloon, and the GoPro would capture everything.
I also decided to put an old Canon A2500 that I had lying around, in the payload. I didn’t really care if this was lost, and it had that advantage of being a Canon camera. This meant that I could install the Canon Hack Development Kit (CHDK) on its SD card. This would allow me to program the camera to take still images at regular intervals. I hoped that these images would perhaps be of better quality than the video which the GoPro would be taking.
Flight Data Recorder
Planning
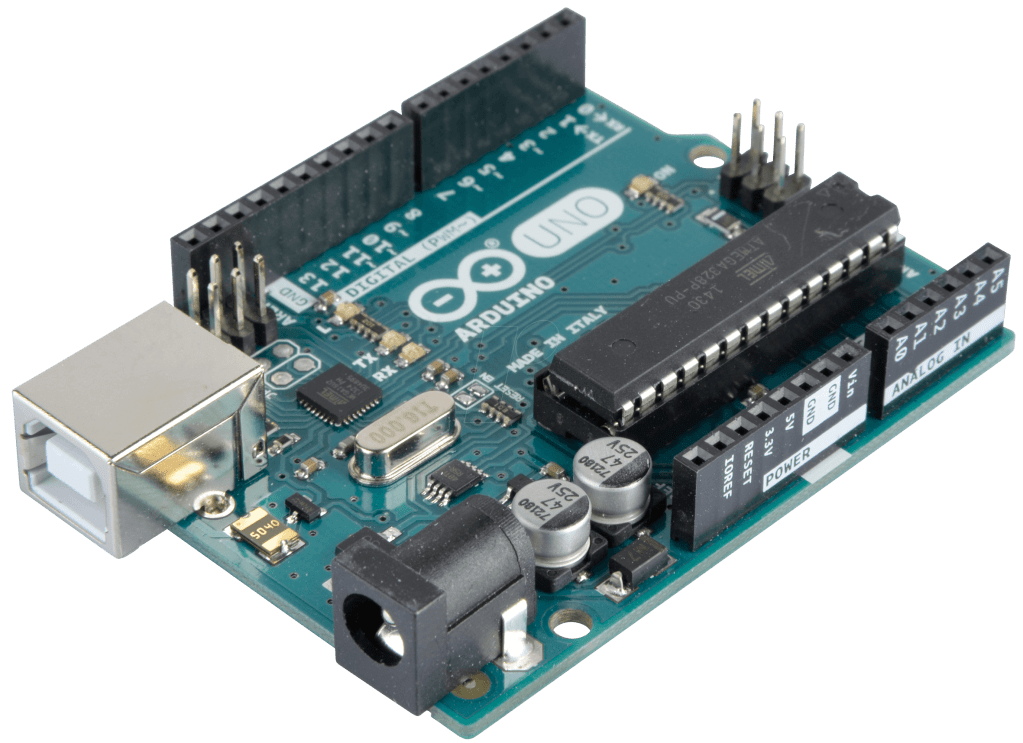
The flight data recorder is a system onboard the payload that would use a variety of sensors to gather environmental data during my flight, and save it to a microSD card. I decided that I wanted to measure the temperature (both interior and exterior), humidity, and pressure. The sensors would be interfaced with using an Arduino microcontroller. This can be thought of as a small computer, that can be programmed to repeatedly carry out a specific task, such as gathering data and saving it. The Arduino Uno that I used for prototyping uses the Atmega328P microcontroller from Atmel (later subsumed into Microchip). It can be programmed in the “Arduino” language, which is basically C++.
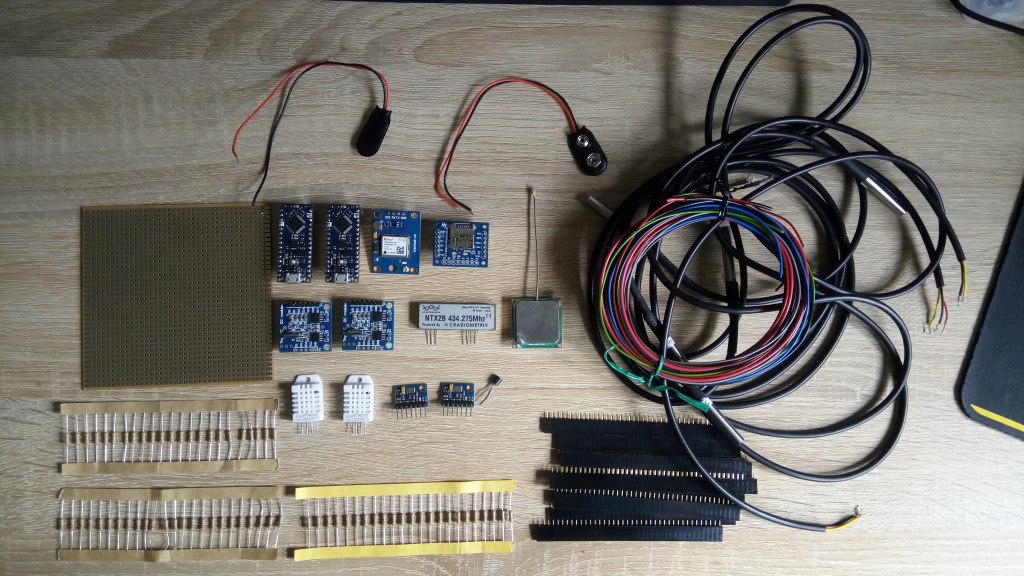
These are the sensors I selected to make the measurements:
- DS18B20 Temperature Sensor
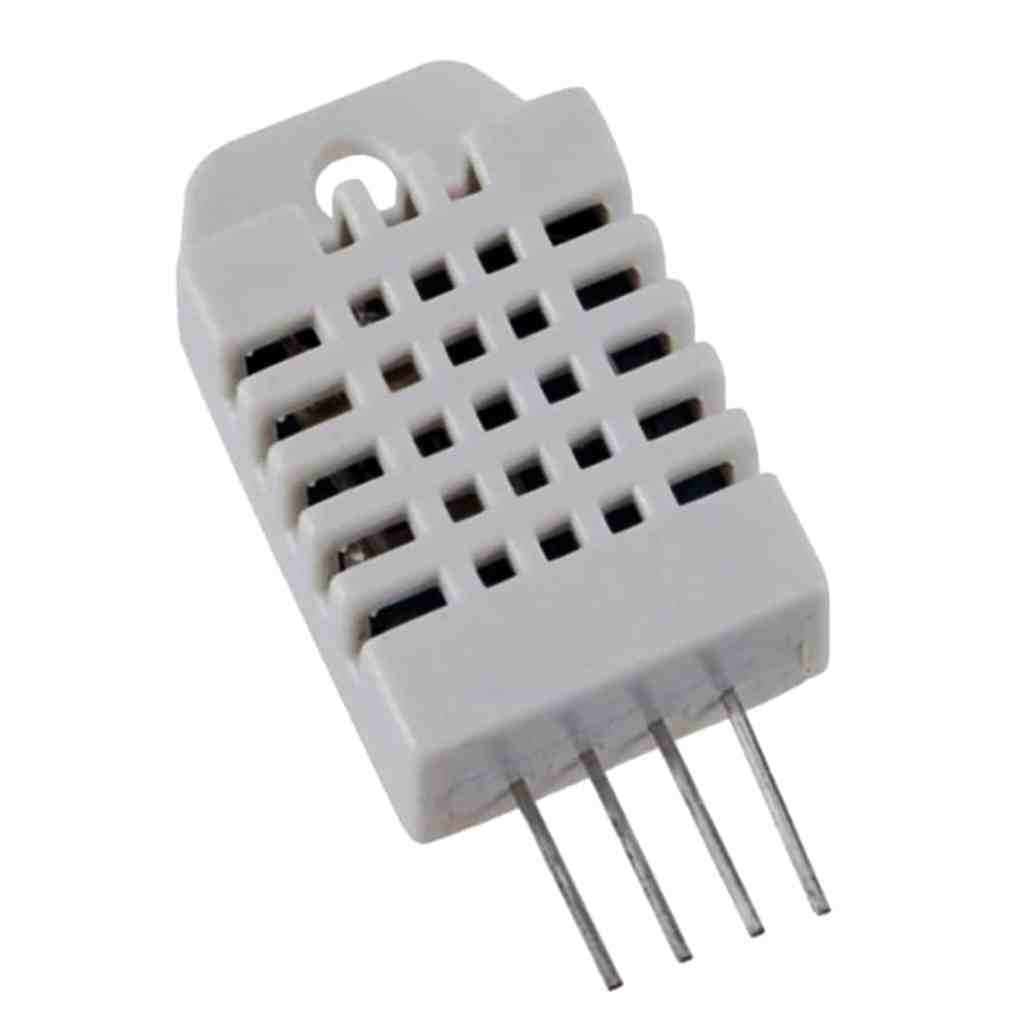
- DHT22 Humidity Sensor
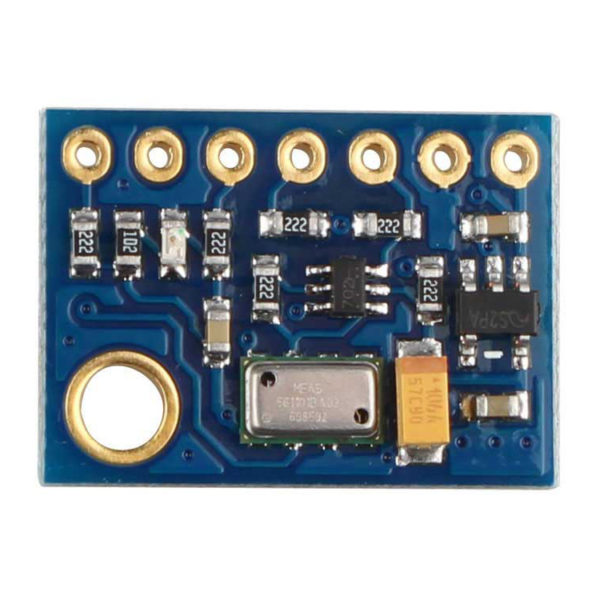
- MS5611 Pressure Sensor
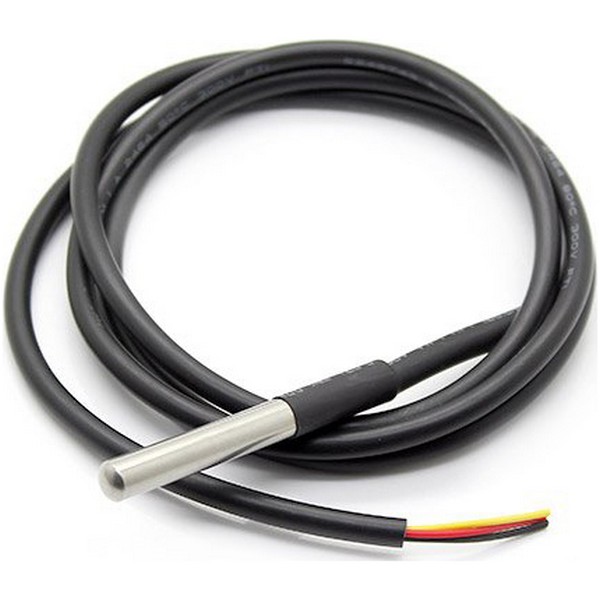
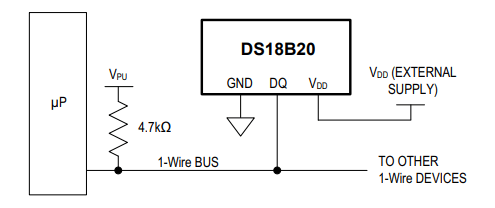
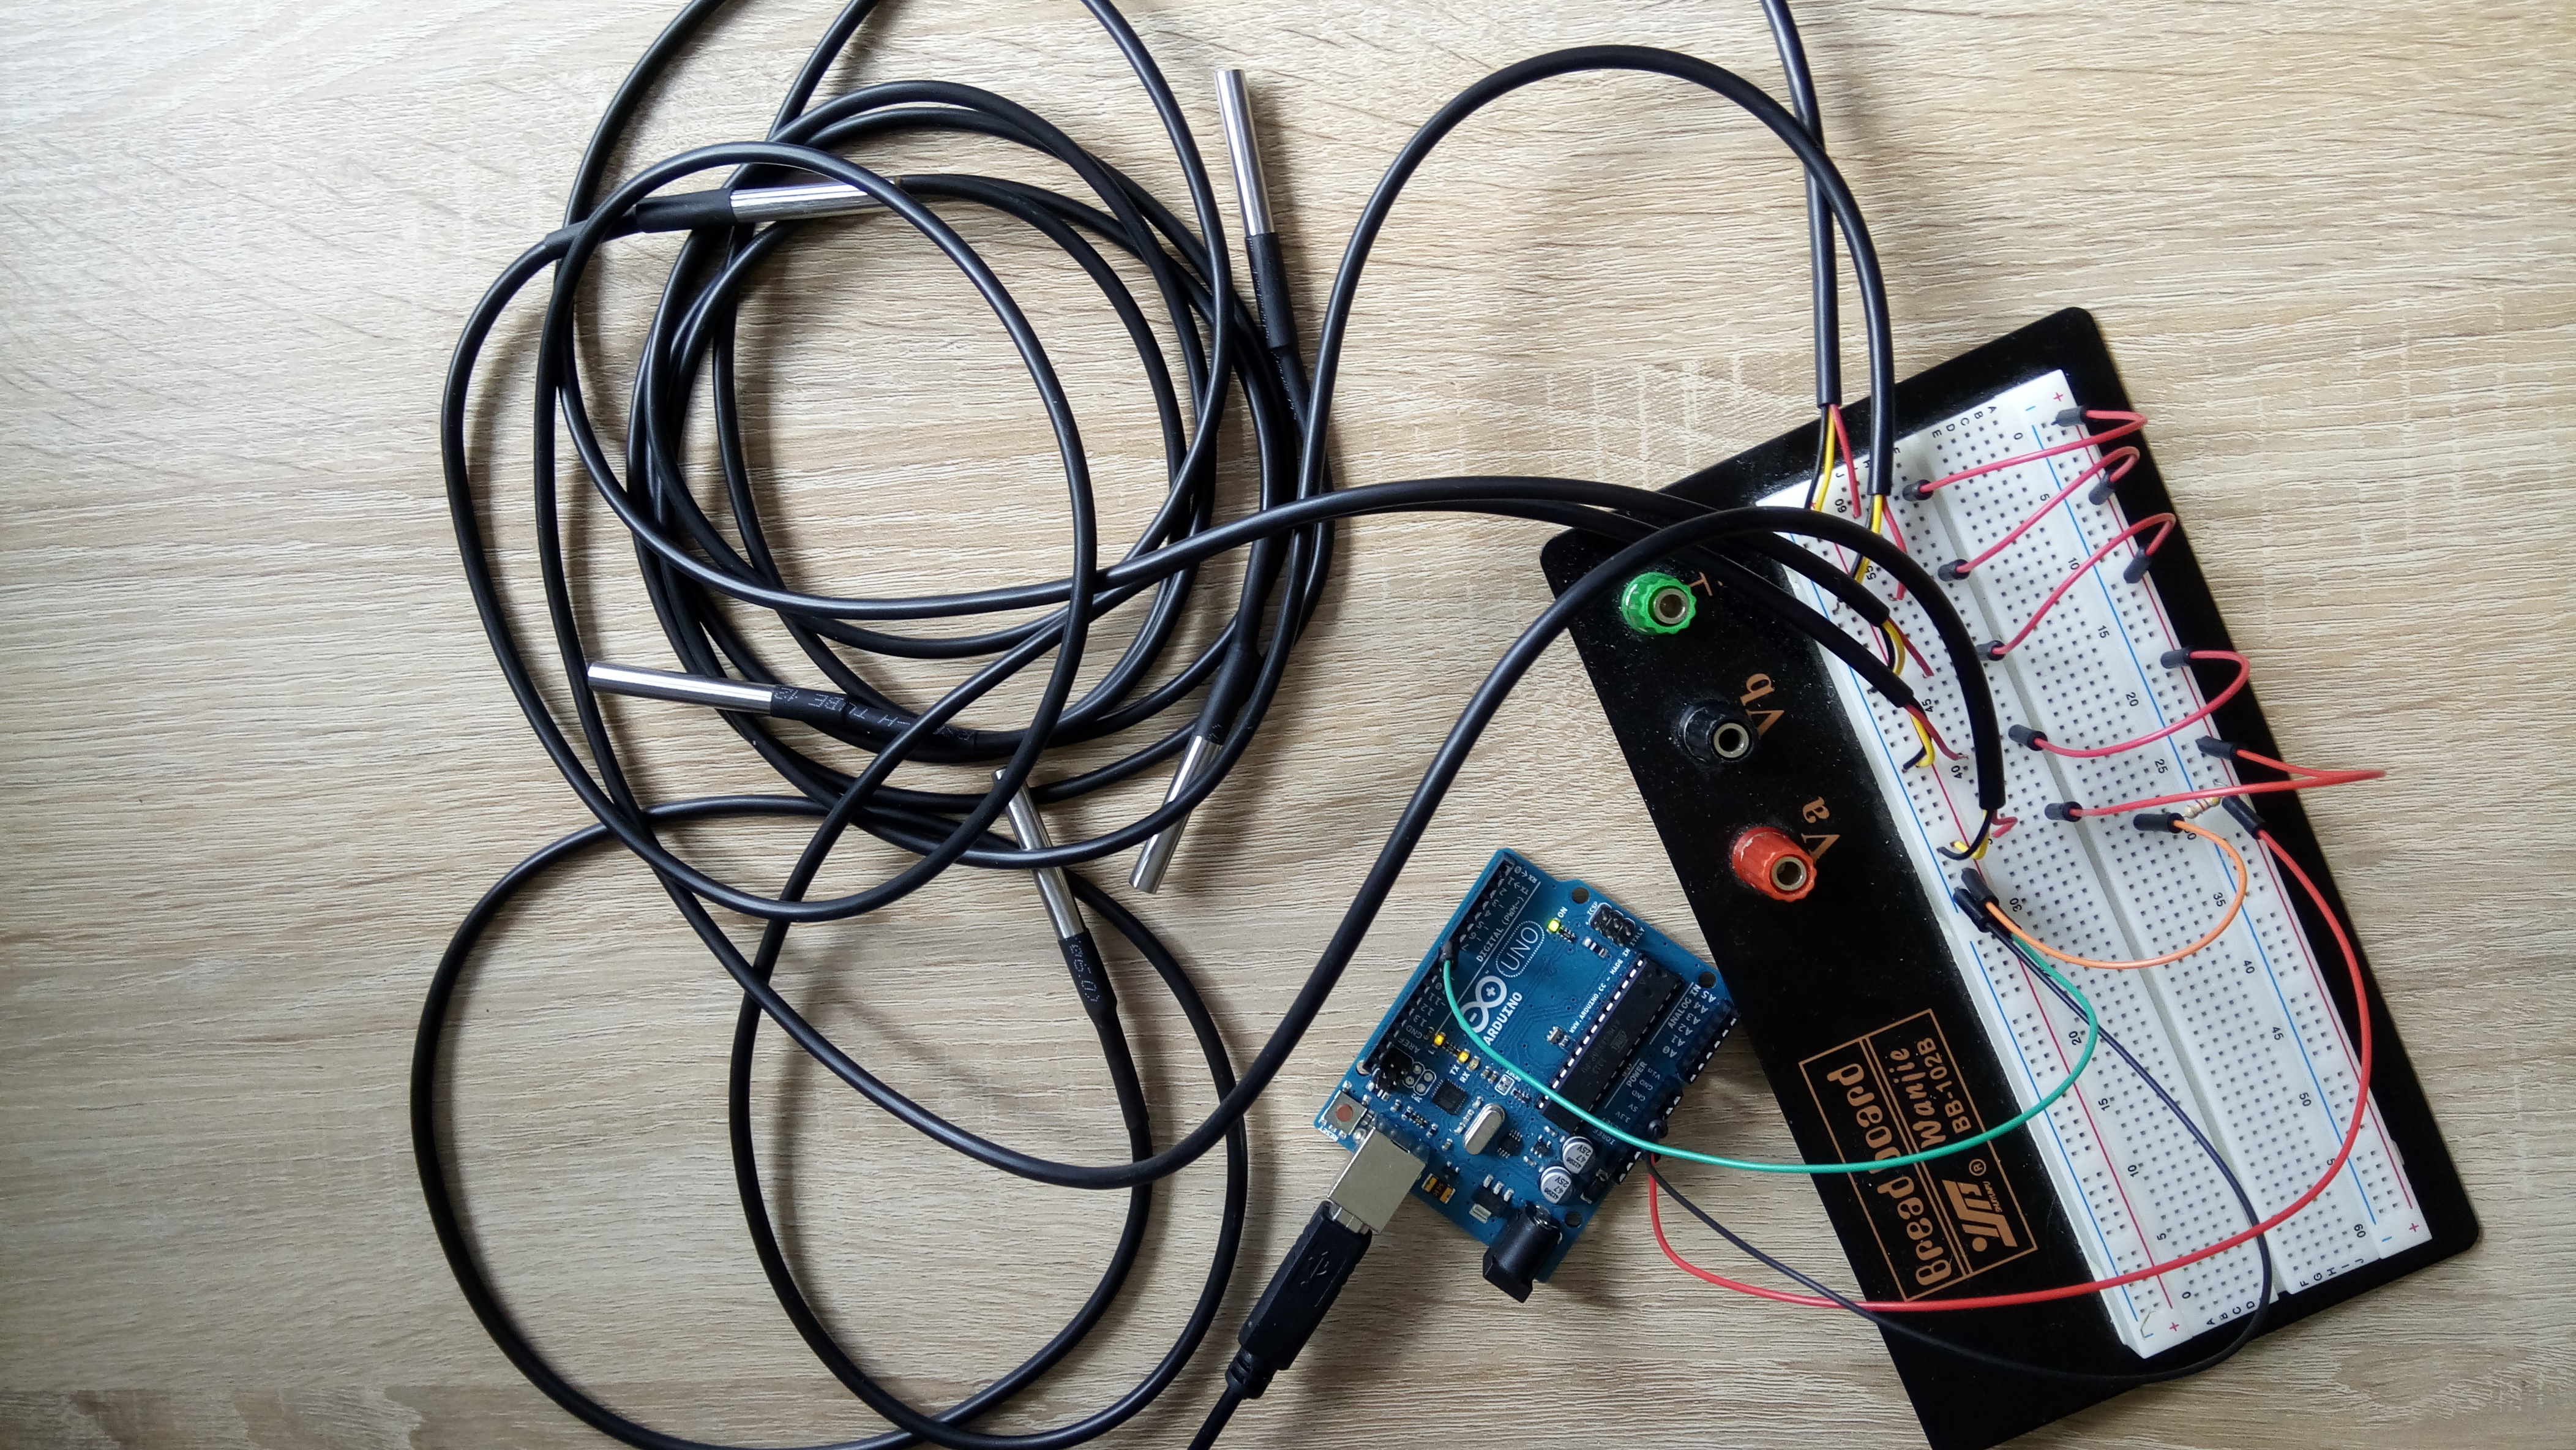
To measure temperature, I selected the DS18B20 temperature sensor, in probe form. It is a digital temperature sensor, originally produced by Dallas Semiconductor (now part of Analog Devices). It uses the 1-Wire communication bus, which was originally designed by Dallas, and only requires a single data line to communicate with a microcontroller. Each DS18B20 sensor has a unique 64-bit serial code, which allows many sensors to be connected to the same bus. This is advantageous, as only one pin of the Arduino is needed to communicate with all temperature sensors. In it’s probe form, the sensor is waterproof, and is functional down to temperatures of -55°C. A pull-up resistor is is required on the data line, the datasheet recommends a value of 4.7kΩ.
The DHT22 sensor is included to measure humidity, although it also provides a temperature measurement (which is less accurate than the DS18B20). DHT11s and DHT22s are very common humidity sensors for hobbyists, I selected the latter as it is rated to a minimum temperature of -40°C, while the DHT11 is only rated to 0°C. Again, only a single data line is needed to interface with the sensor, through the protocol described in its datasheet. Unfortunately, this line cannot act as a bus, and so two separate lines were needed for the two sensors that I used.
I selected the MS5611 pressure sensor because it can measure pressures down to 10 millibars. The very popular BMP/BME series of sensors from Bosch also measure pressure, but only down to 300 millibars. Atmospheric pressure at sea level is around 1000 millibars, and at the sort of altitudes I could expect my balloon to reach, the pressure can drop to 1/100th of that at sea level (10 millibar). I bought a sensor on a breakout board from Hobbytronics, as this would make it much easier to work with. This sensor uses I2C to communicate with the Arduino. I2C is a synchronous serial communication bus developed by Philips Semiconductors, and is one of the most widely used serial communication protocols, particularly between microcontrollers and peripherals. The Arduino is compatible with I2C, and uses its A5 and A4 pins as the clock (SCL) and data (SDA) lines respectively. Pull-up resistors are also required on the SCL and SDA lines.
I also decided to include a real time clock (RTC) in the system, to keep track of the time at which measurements were taken. I selected the widely used, and readily available DS1307 RTC, on a breakout with a coin cell battery. The RTC also communicates with the Arduino using the I2C protocol. It can be connected to the same lines as the pressure sensor, as in I2C, all peripherals are referenced by a 7-bit address, so that only one is communicating with the microcontroller at any one time.
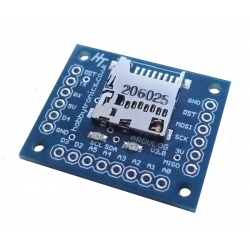
All the data gathered by the sensors obviously needed to be stored somewhere. I used an Ardulog datalogger with a microSD card to store all data. The Ardulog itself is now discontinued, but it is quite similar to the Openlog device developed by Sparkfun. The device has a separate microcontroller onboard, which deals with talking to the SD card, and I can just send serial data to the Ardulog over UART, and it will get saved to the SD card. Universal Asynchronous Receiver/Transmitter (UART) is another common serial communication protocol commonly used by microcontrollers.
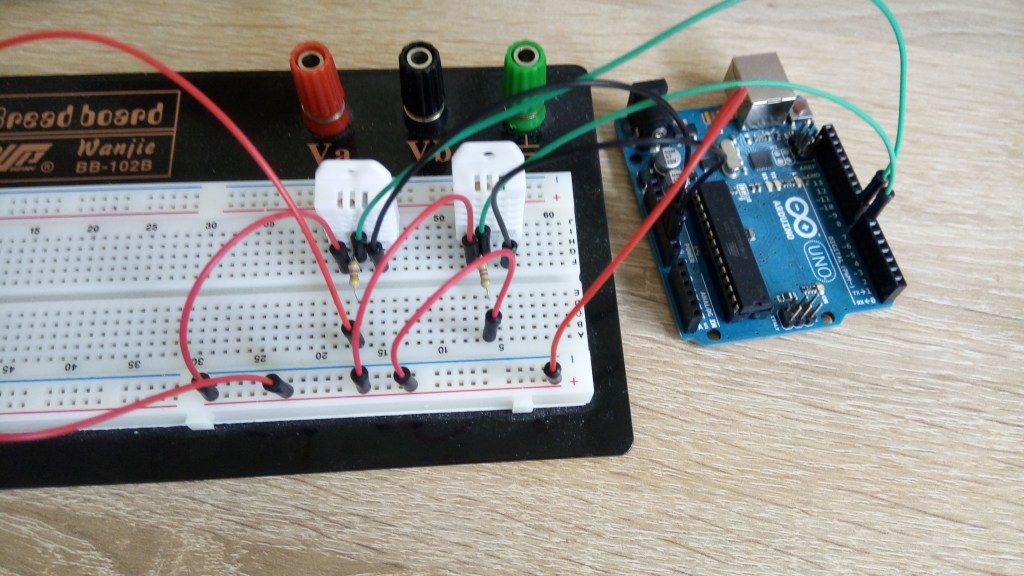
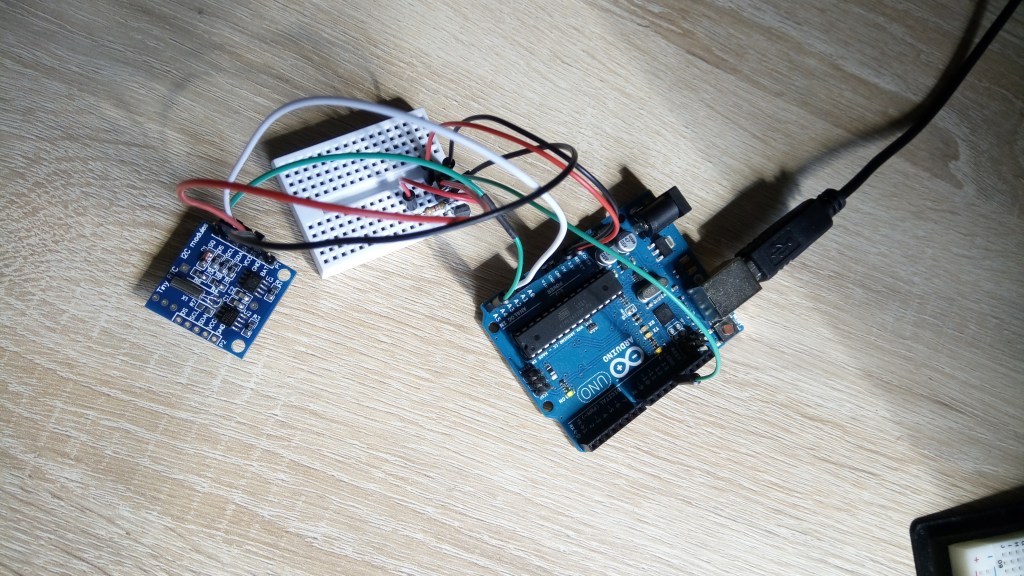
Testing
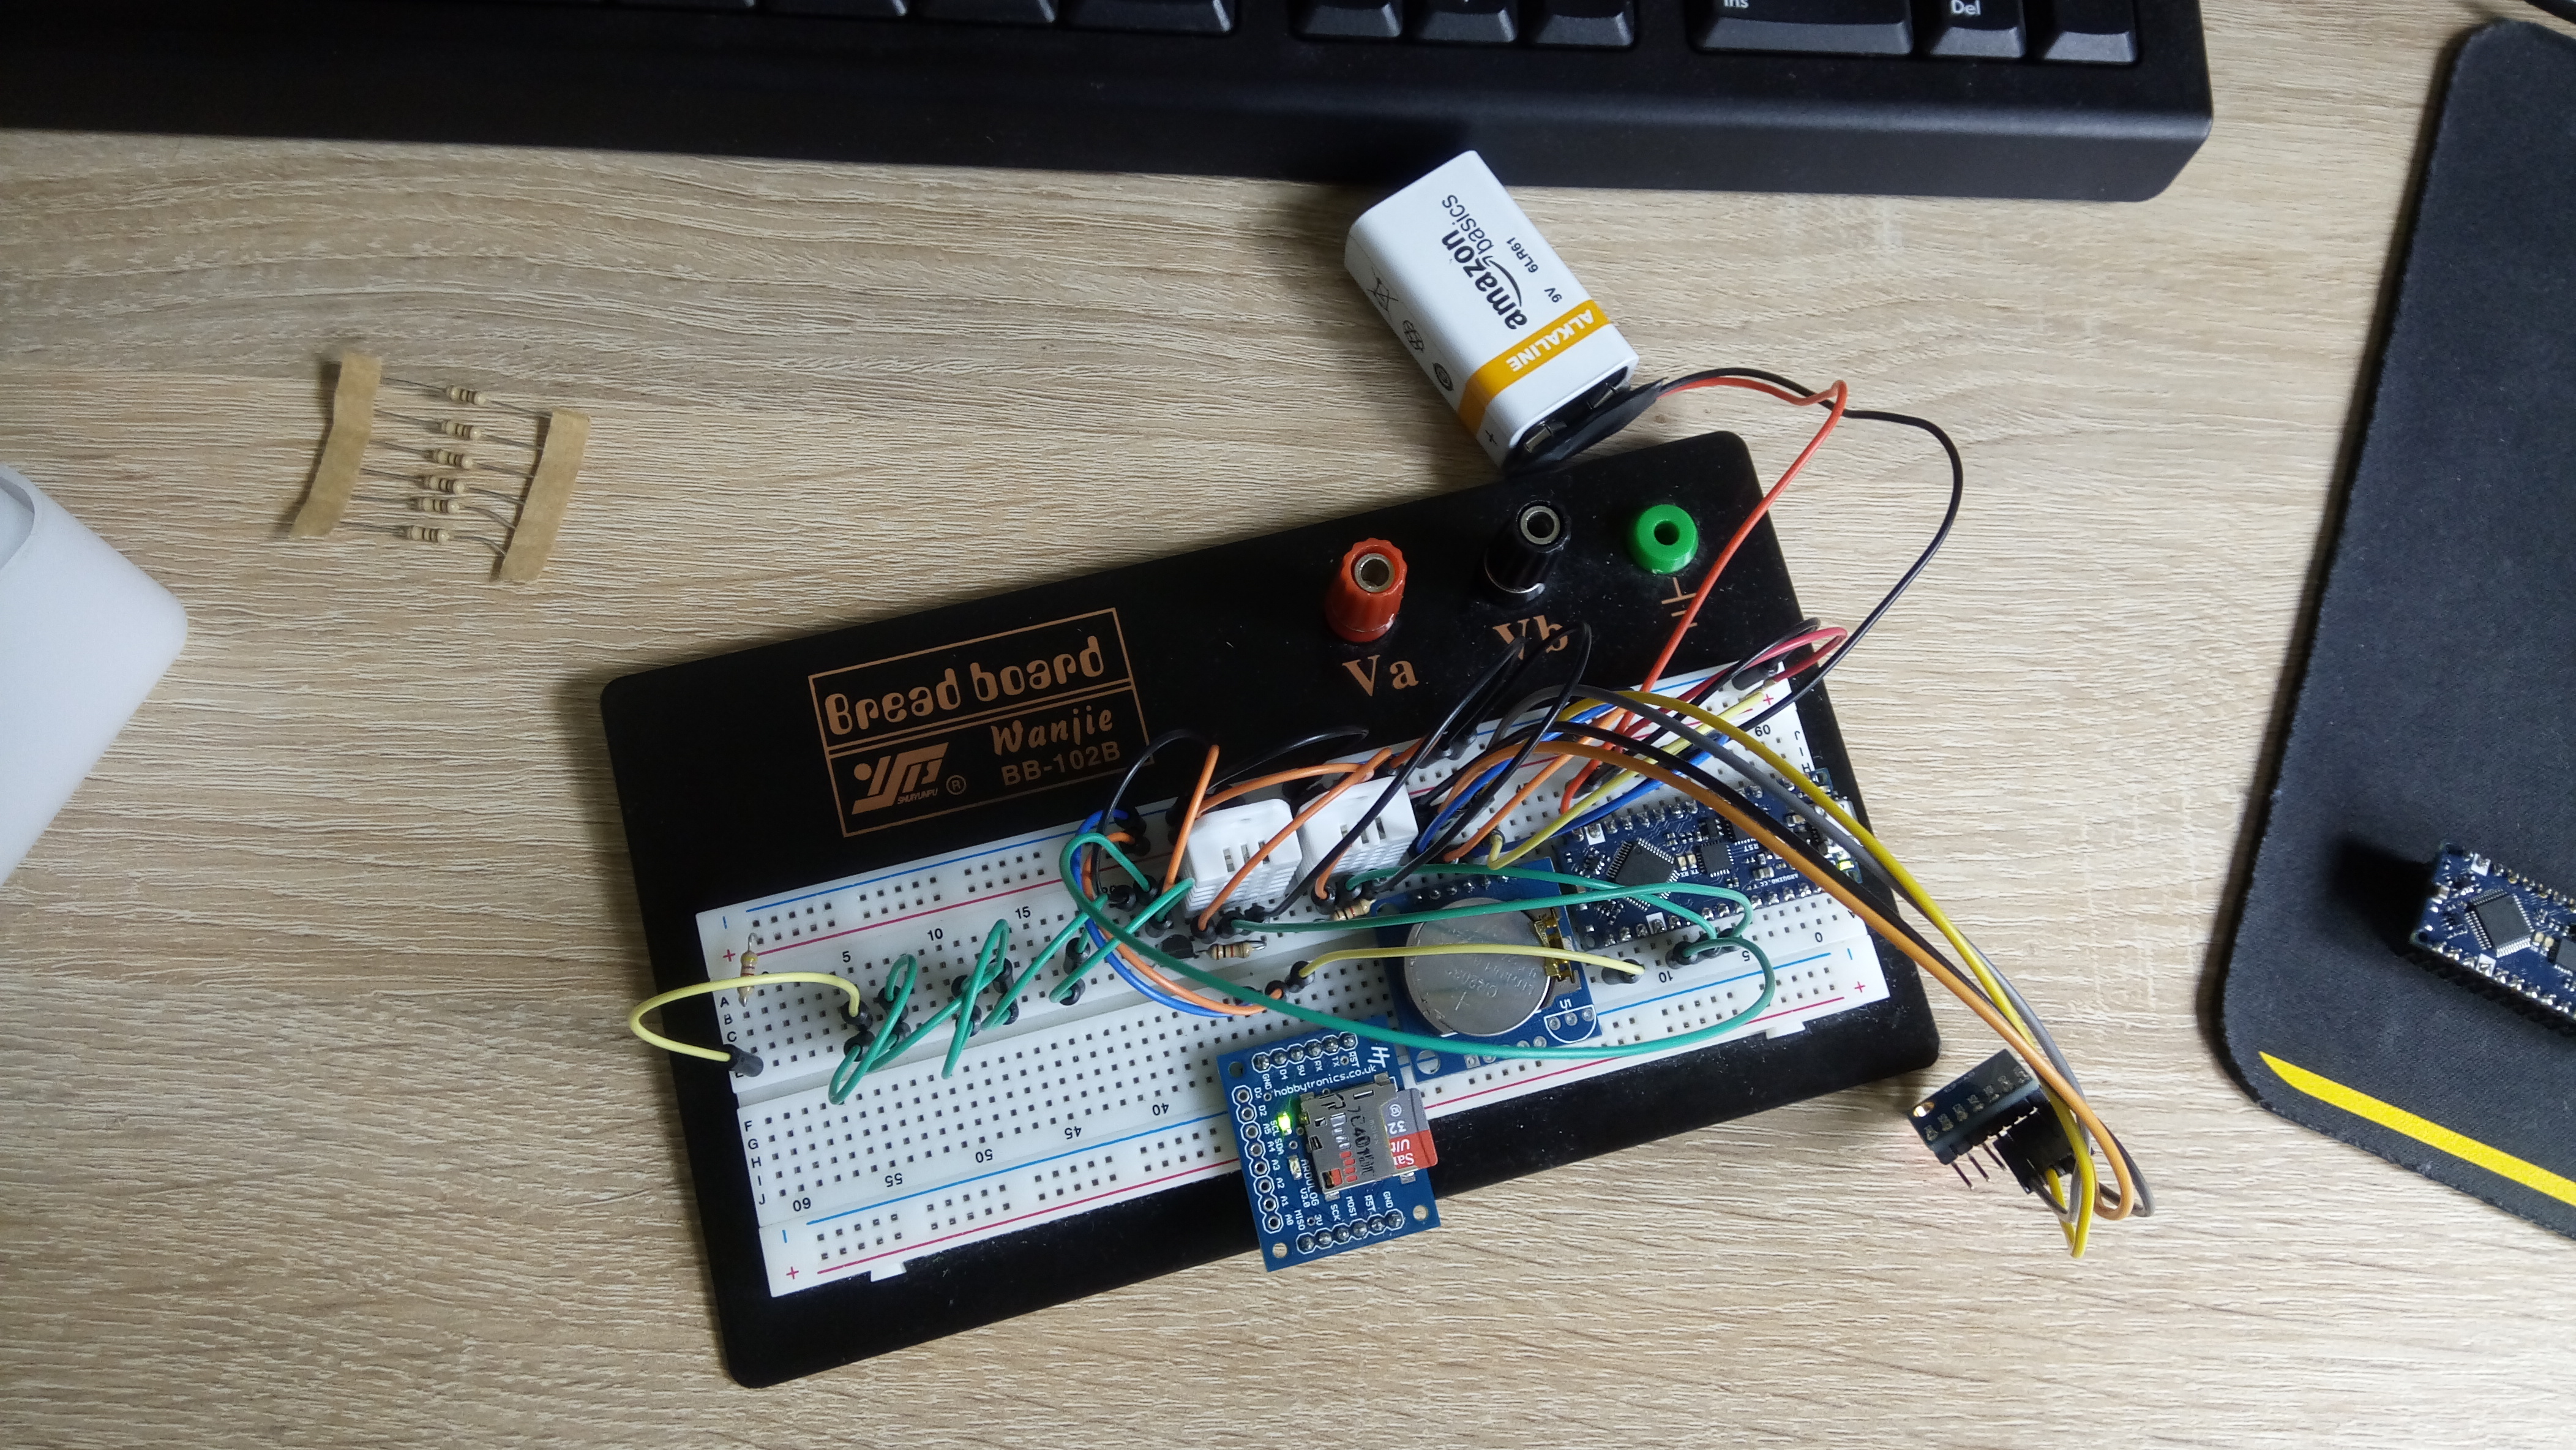
Given the abundance of pre-made libraries to interface with the various sensors, and numerous online accounts of people who had previously used them, getting the sensors all to work was rather easy. If all connections were made properly, and the necessary pull-up resistors were included, all the sensors would work as soon as I uploaded one of the example programs from their libraries. I also conducted a test where I ran all the sensors at the same time, and printed their data to the serial port that the Ardulog was connected to, to ensure that the flight data recorder system worked. (It did).


I decided to use the Arduino Nano Every in the payload rather than the Arduino Uno for a number of reasons. Firstly, it could be easily connected to a piece of stripboard. Using jumper wires from an Uno would not be smart, as they are less secure. It also has a more powerful microcontroller (ATmega4809) than the Uno (ATmega328P), which allows for faster processing and more complex tasks. Another advantage of the Nano Every is that it has a built-in voltage regulator, which means that it can be powered directly from a 9V battery without the need for an external voltage regulator. Finally, the Arduino Uno only has a single hardware serial (UART) port, located on pins 0 and 1. However, it is also connected to the USB interface, which is how the Arduino is programmed. This means that you cannot use devices connected to the hardware serial port while the Arduino is connected to computer. Instead, the Arduino Nano Every has two hardware serial ports. One of these (Serial0) is dedicated to the USB interface, while Serial1 is connected to pins 0 and 1. This means that you can communicate with devices over serial, while still connected to your computer, making debugging much simpler.
Tracking System
Planning
The tracking system is perhaps the most important system in the payload. It is responsible for gathering position data, and transmitting that back to the ground, so that the balloon can be chased and recovered. There are a variety of ways in a which a balloon can be tracked, using cellular signal, using a commercial GPS tracker, but the most commonly used, and reliable method of tracking, is to use a custom radio/GPS tracker. This will use a GPS module to figure out where it is, then transmit that data (along with anything else you fancy) via a radio module. Again, this system would be controlled by the Arduino microcontroller.
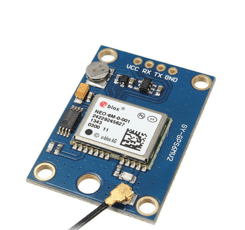
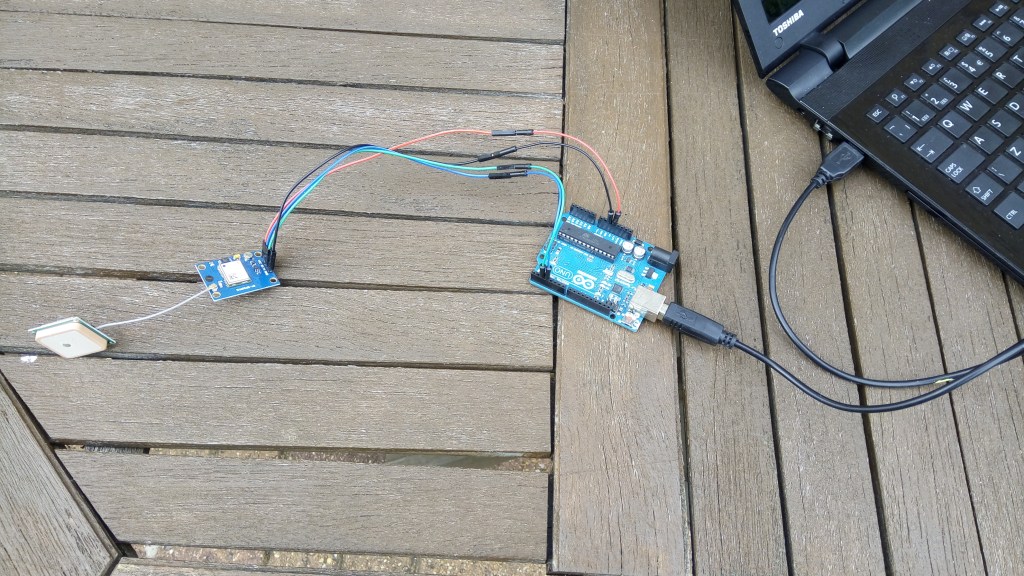
I bought the Ublox NEO-6M GPS module, to connect to GPS satellites, and figure out the latitude and longitude of the balloon. The NEO-6M communicates with the Arduino over UART serial, like the Ardulog. I used the TinyGPS++ library to extract the GPS data I was interested in from the rather enigmatic NMEA sentences.
As some readers may have noticed, both the GPS module and the Ardulog use UART for communication. However, the Arduino Nano Every only has one available hardware serial port since one is dedicated to the USB interface. There are actually two additional hidden serial ports that are not well-known, but I was not aware of this at the time. To address this issue, I utilized the SoftwareSerial library to create a software serial port. This involves “bit banging” where the communication process is handled in software instead of using dedicated hardware. Unfortunately, I later discovered that the SoftwareSerial library was causing timing issues within the Arduino’s internal processes, which affected my radio transmission code. To resolve this, I ended up using two Arduino Nano Every boards in the payload and completely separating the flight data recorder and the tracker.
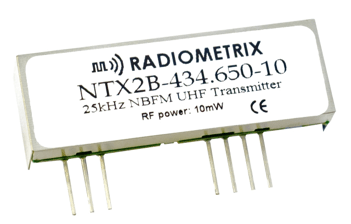
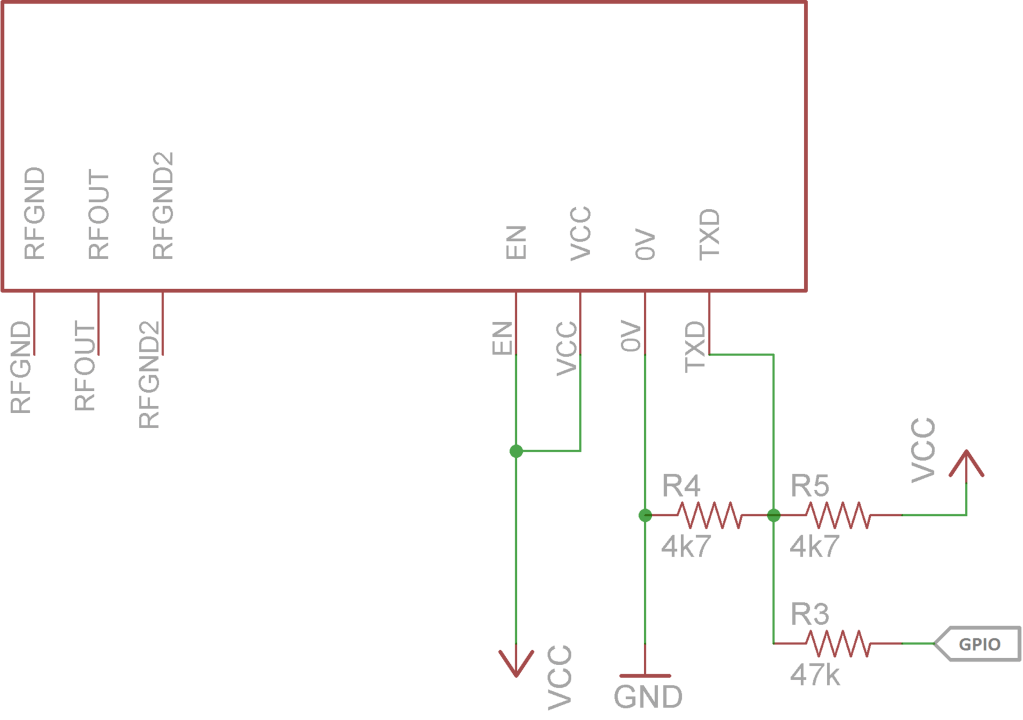
To transmit the location data, I decided to use a NTX-2B radio transmitter I bought from Uputronics. Unfortunately I don’t think you can get these anymore, Radiometrix, who made them, seems to possibly be defunct? The NTX-2B operates in a license-free frequency band – at 434.275MHz, with a transmission power of 10mW. This is rather low, but is the maximum power for this license-free band. However, as the balloon will be high in the sky, it is likely that I will be able to get a line-of-sight to the transmitting antenna, significantly improving the transmission range.
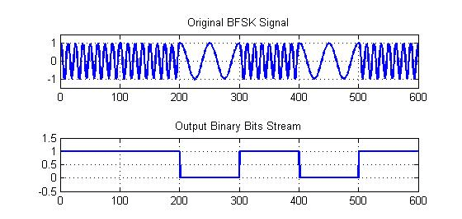
A digital pin of the Arduino can be used to modulate the signal from the radio module. In the setup shown below, applying 5V to the GPIO port will shift the transmitting frequency by 480Hz. This allowed me to employ a binary frequency shift keying (BFSK) modulation scheme to transmit RTTY data. The BFSK diagram shows an exaggerated version of how this can be used to transmit binary data.
Testing
Getting the tracker to work was quite a bit harder than getting the flight data recorder to work. I spent quite a bit of time being puzzled over gibberish-filled transmissions, before realising that the SoftwareSerial library affected the Arduino timing, and then switched to using two separate Arduinos, as mentioned earlier. The GPS module was a little finnicky to work with as well, as I would have to be outside, so it could see the sky, for it to get a proper GPS lock. Sometimes this would take quite a while as well. Eventually I got all the components to play nicely together. In the end, I did not only transmit position data, but also the time, interior temperature, and ambient pressure. I had to use multiple sensors to do this, as the flight data recorder and tracking systems were now completely isolated from one another.
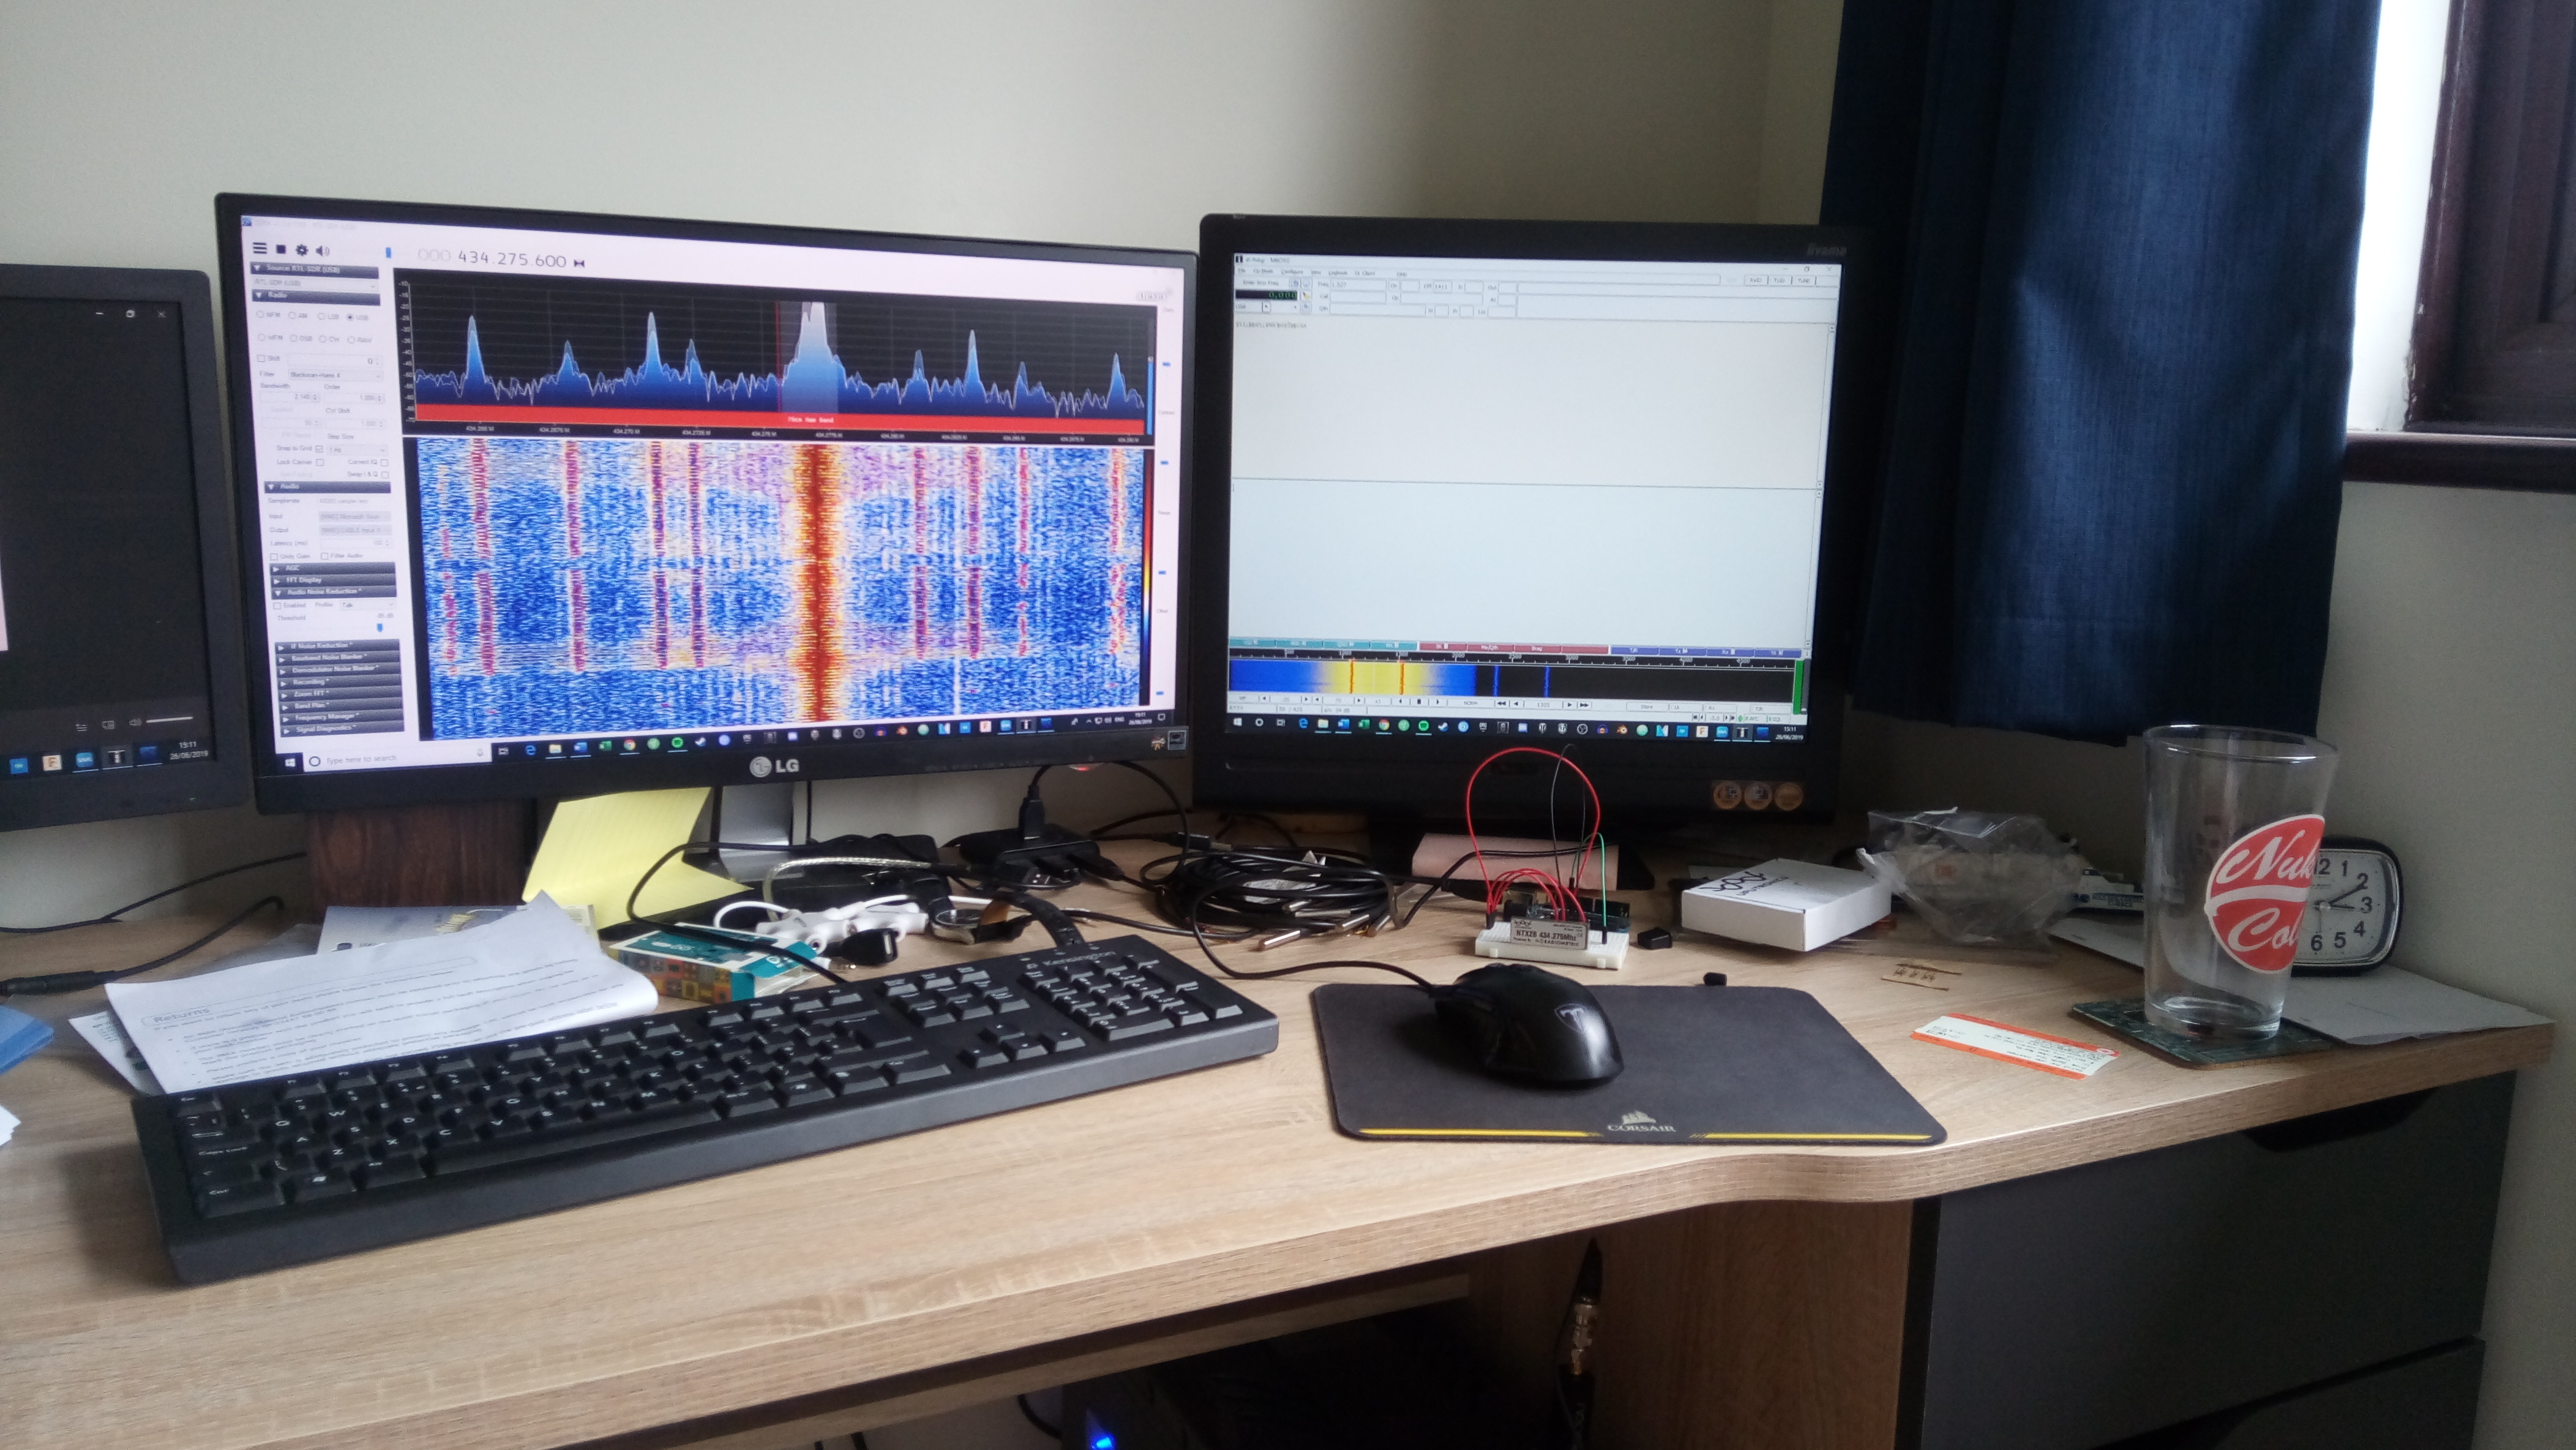
I did not fancy buying an expensive radio just to track a single balloon flight, so I opted to use something know as a Software Defined Radio (SDR). This would interpret the radio signal in software, turning it into an audio signal. I could then pass this to a program known as dl-fldigi, to decode the audio into the originally transmitted data. This method of receiving is described in more detail on the UKHAS website. I bought a NooElec NESDR Smart dongle, along with a 3/4 wave antenna, then used the SDR# software in conjunction with dl-fldigi to successfully transmit data from the Arduino to my computer over radio:

Looking at the decoded transmission sentences in the upper window, you can see two dollar signs ($$), which indicates the start of a transmission, the balloon callsign (RANGER1), followed by some data, the latitude, longitude and altitude. The transmission is terminated by a CRC16 CCITT checksum, which allows the receiver to check that all the data was correctly received.
Construction
Circuit Construction
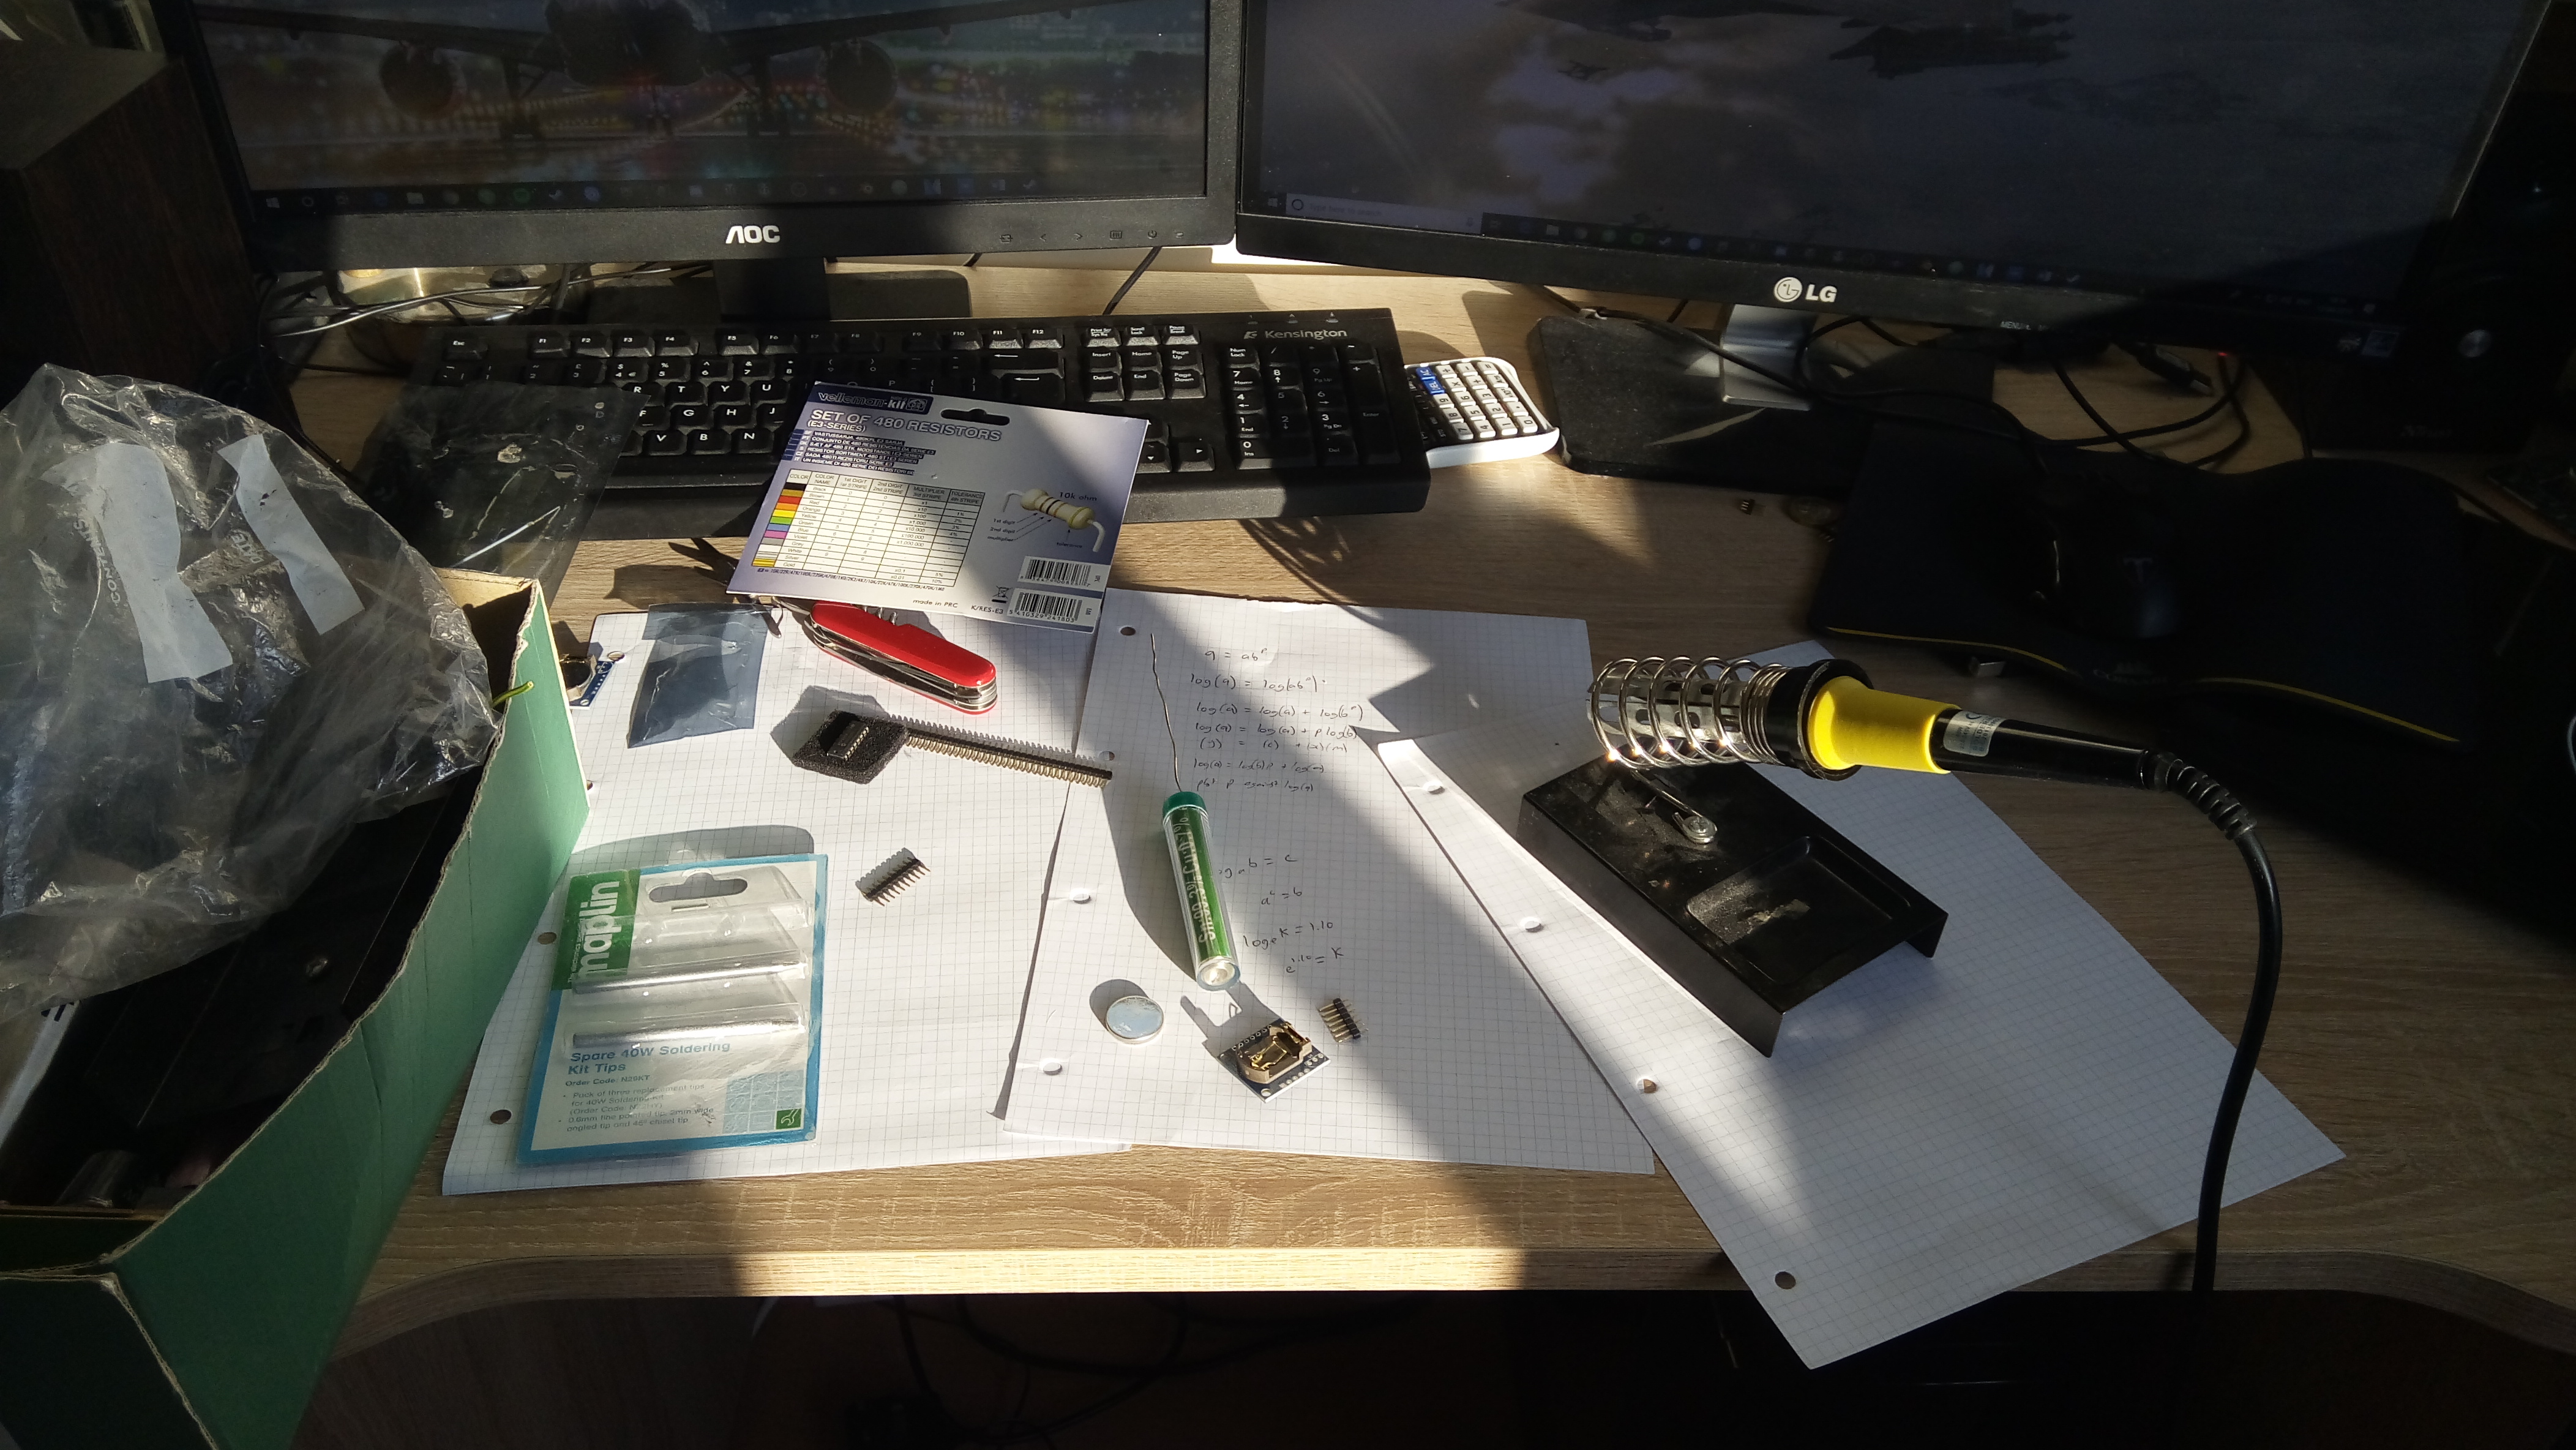
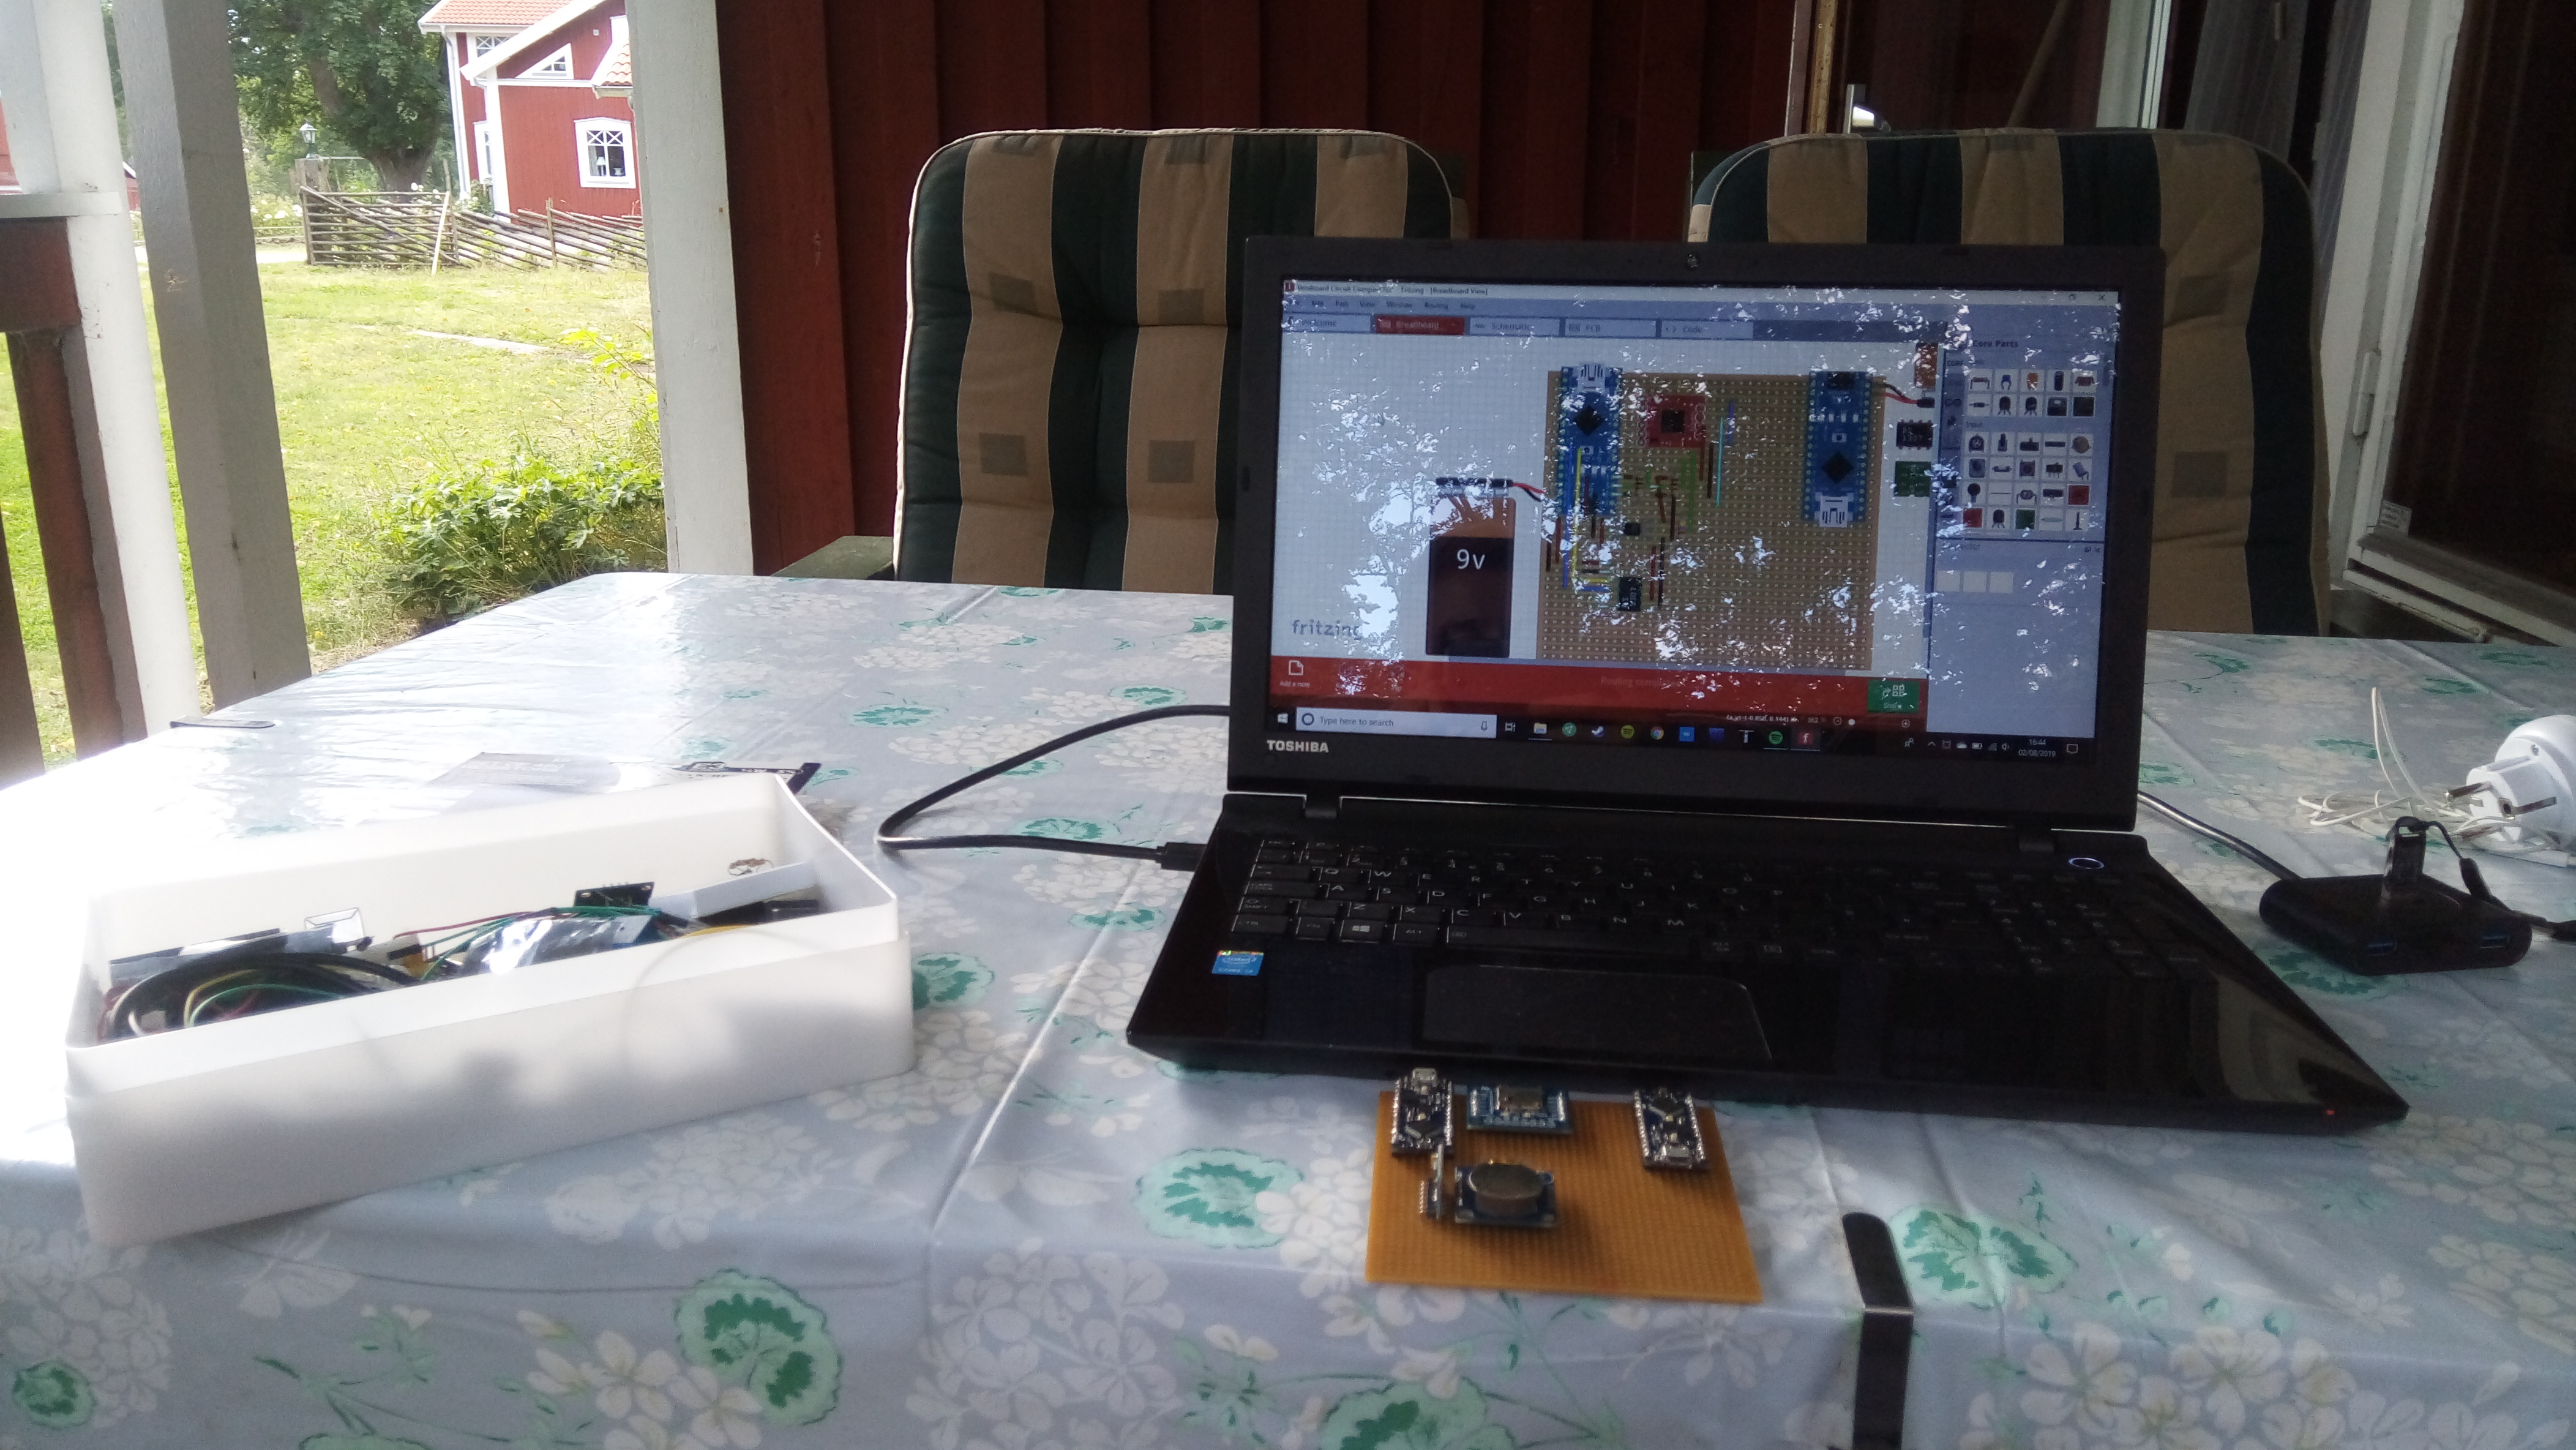
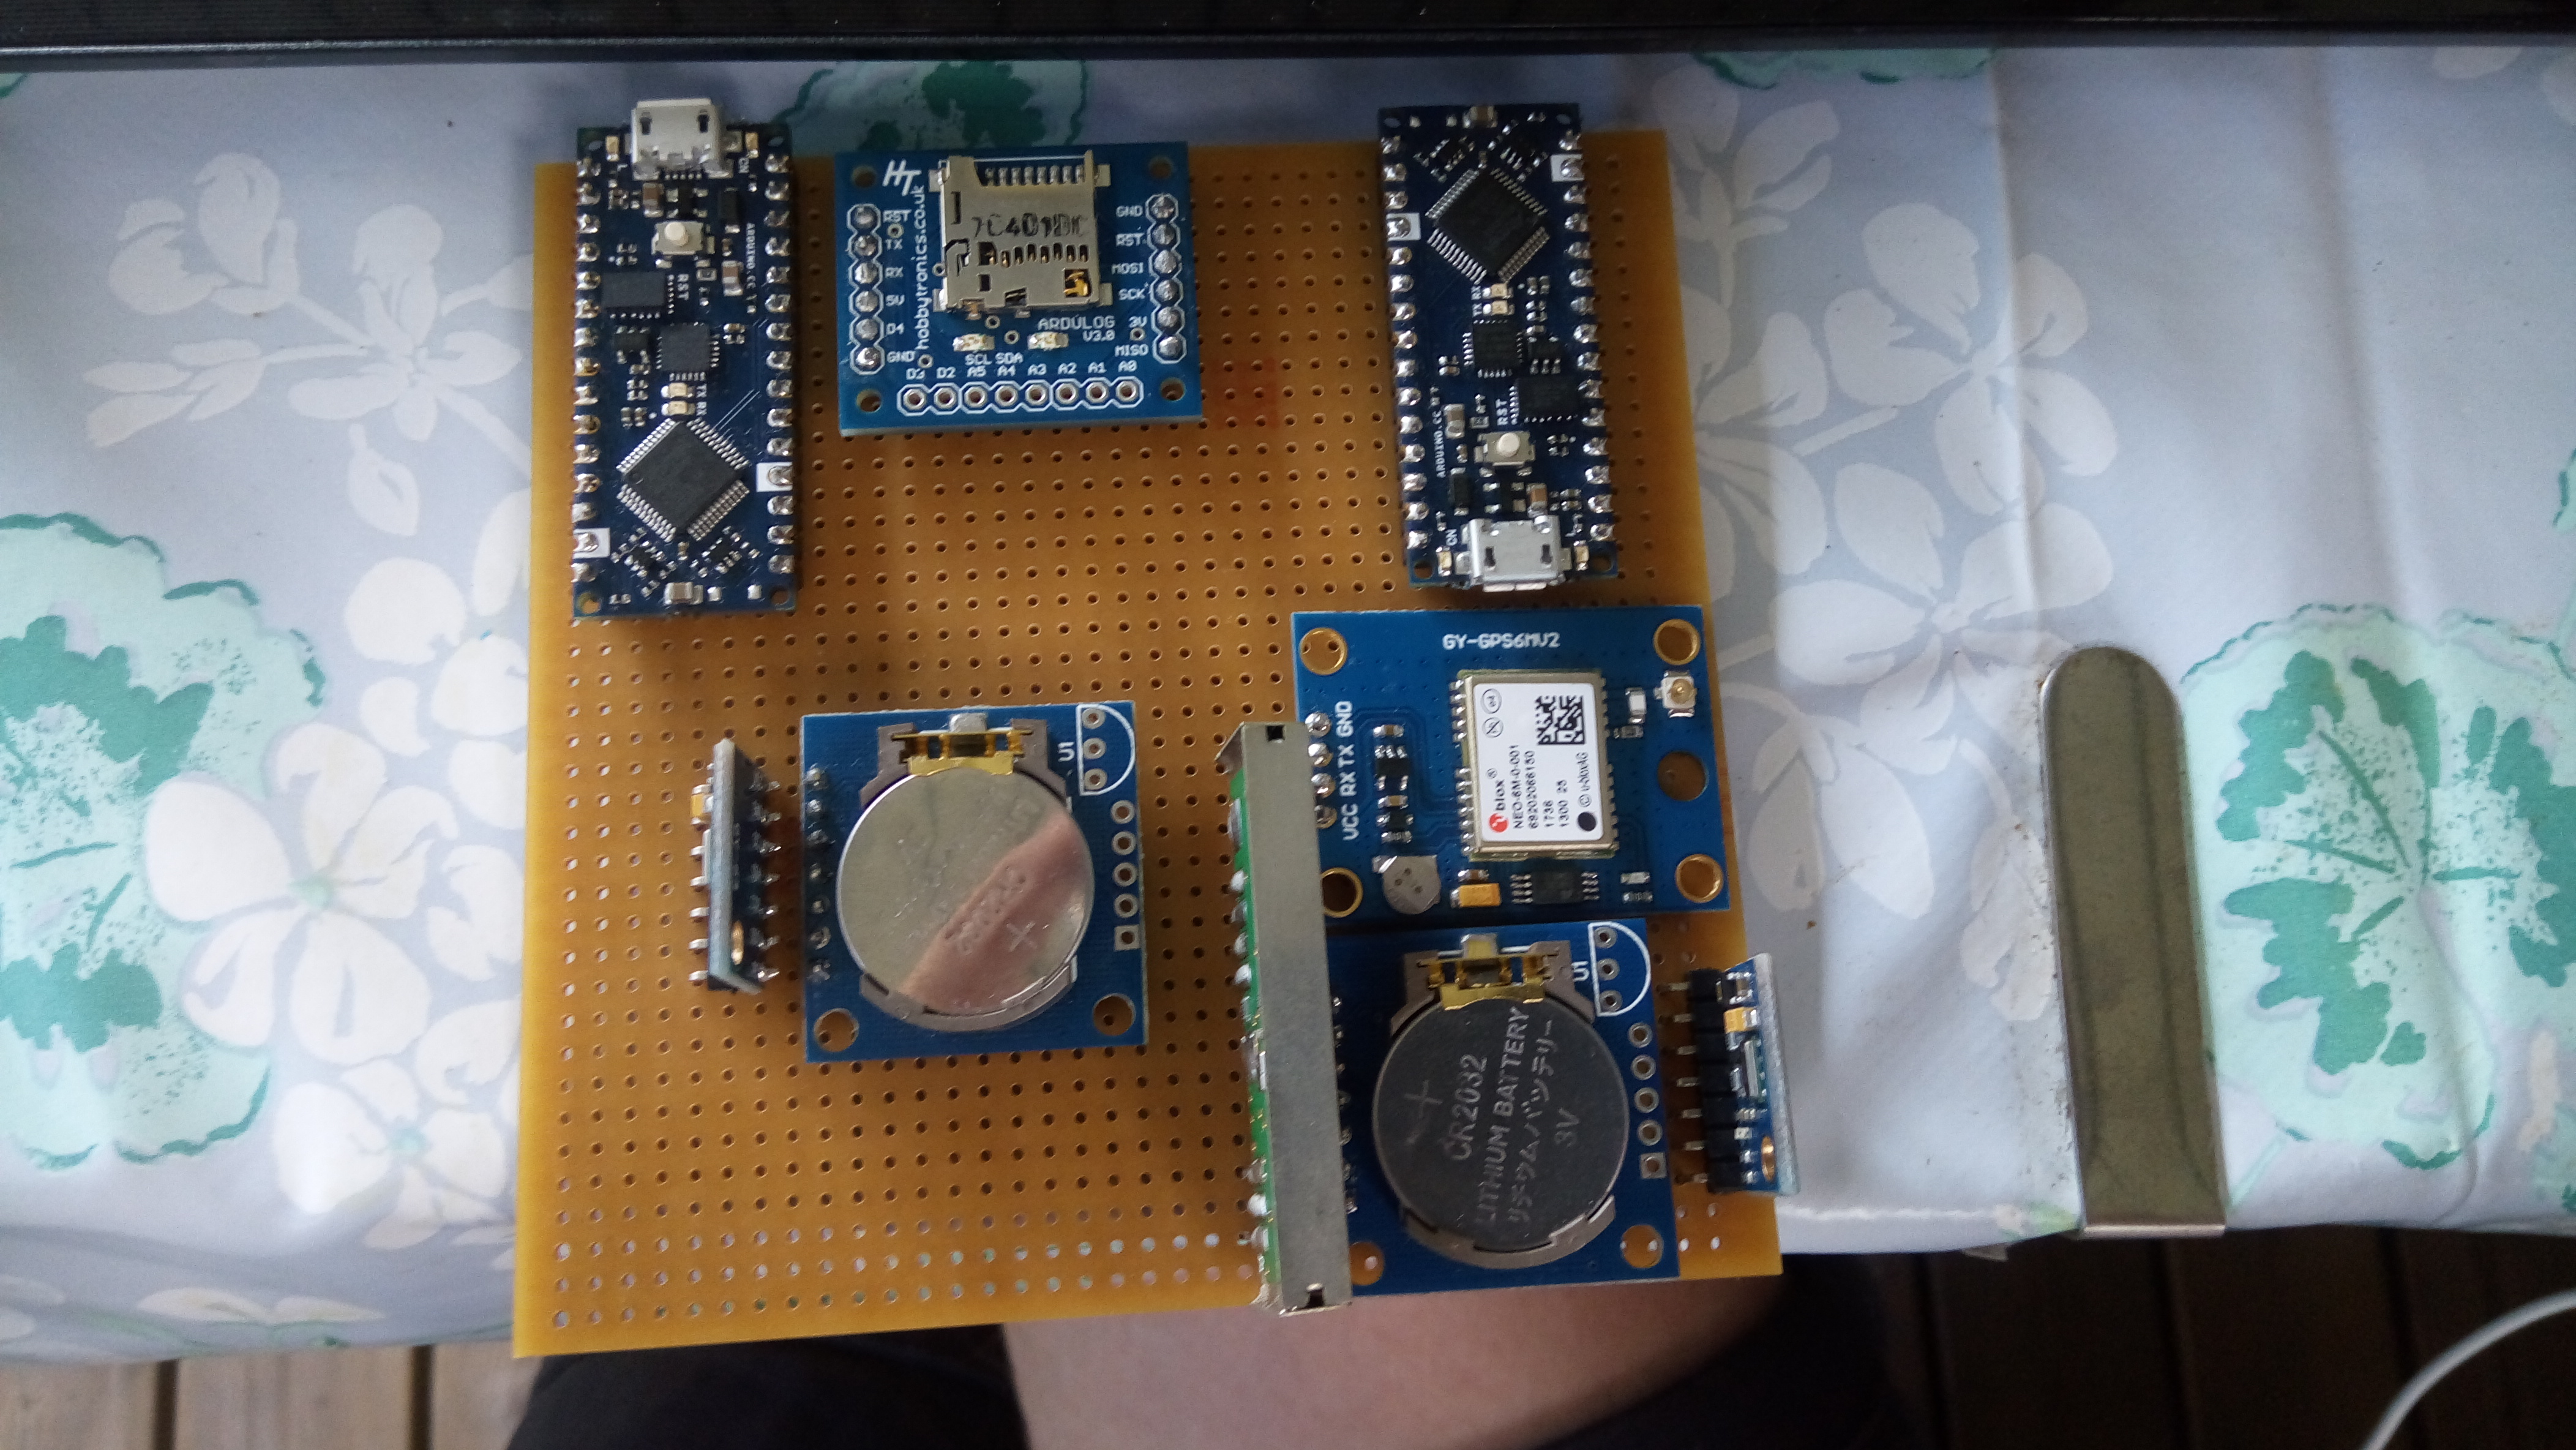
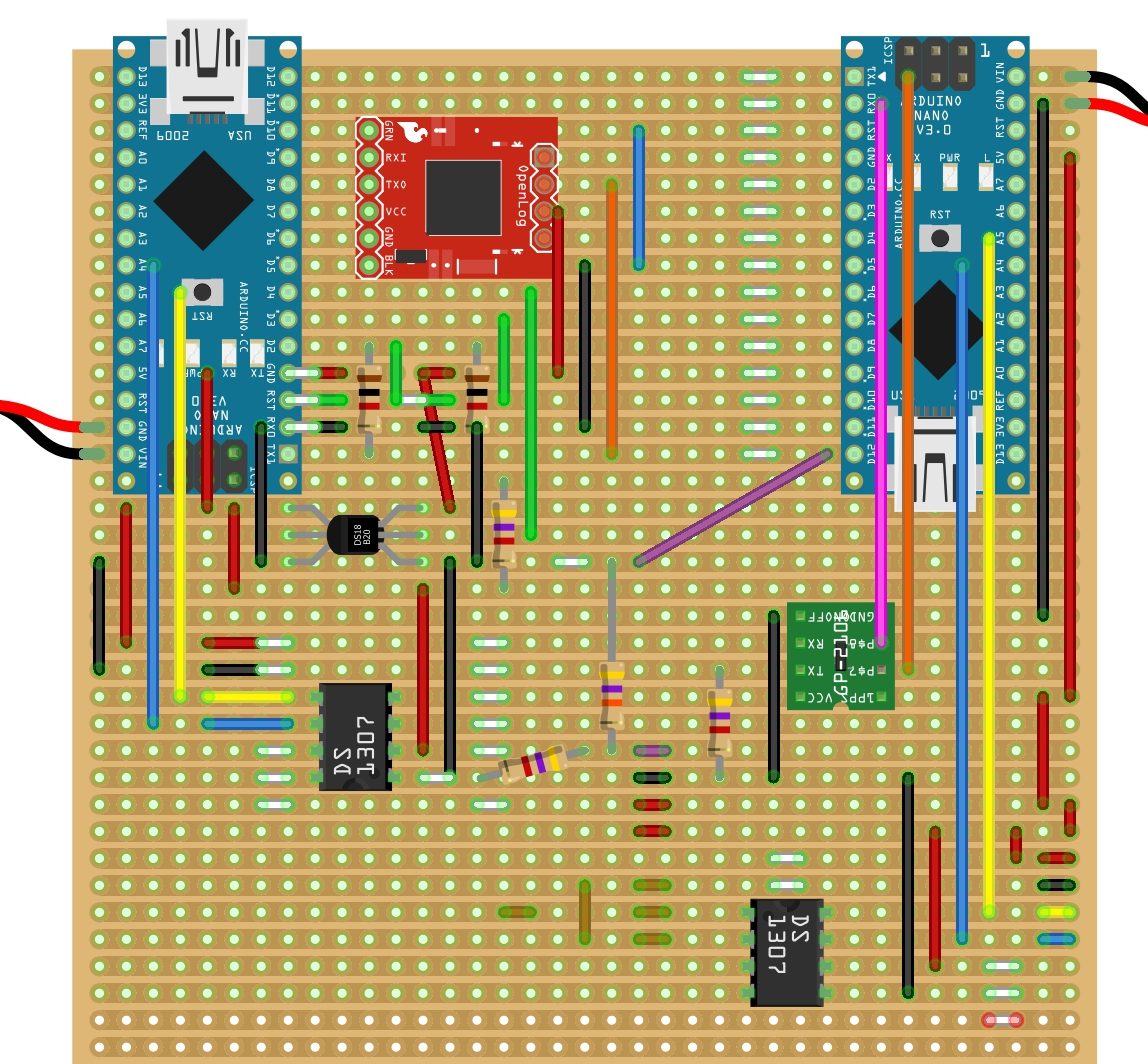
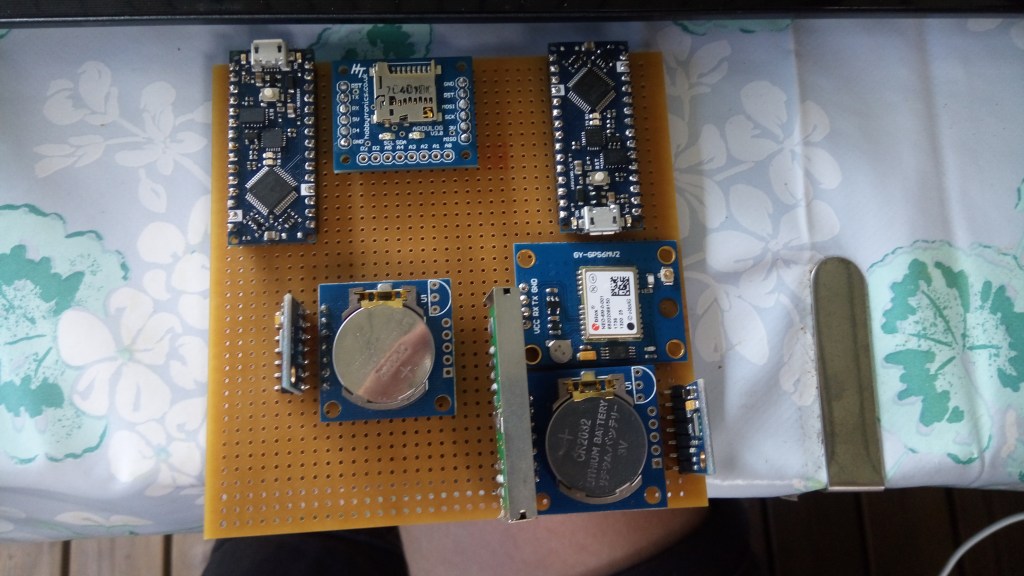
Once all of the payload systems had been tested on breadboards, I proceeded to create a more permanent layout by soldering headers, jumper wires, and discrete components onto a stripboard. To make future testing and reuse of components easier, I opted to solder headers to the board rather than breakouts. Prior to beginning any soldering, I carefully planned out the layout to ensure that all the components would fit on the board. To aid in this process, I utilized a software tool called Fritzing, which I had previously learned to use while documenting circuits for earlier tests.
Often, components that I was using did not have proper equivalents in Fritzing, so I often used placeholders, and short lengths of wire to represent pins of components. Short lengths of white wire represented where cuts needed to made in tracks to break a connection.
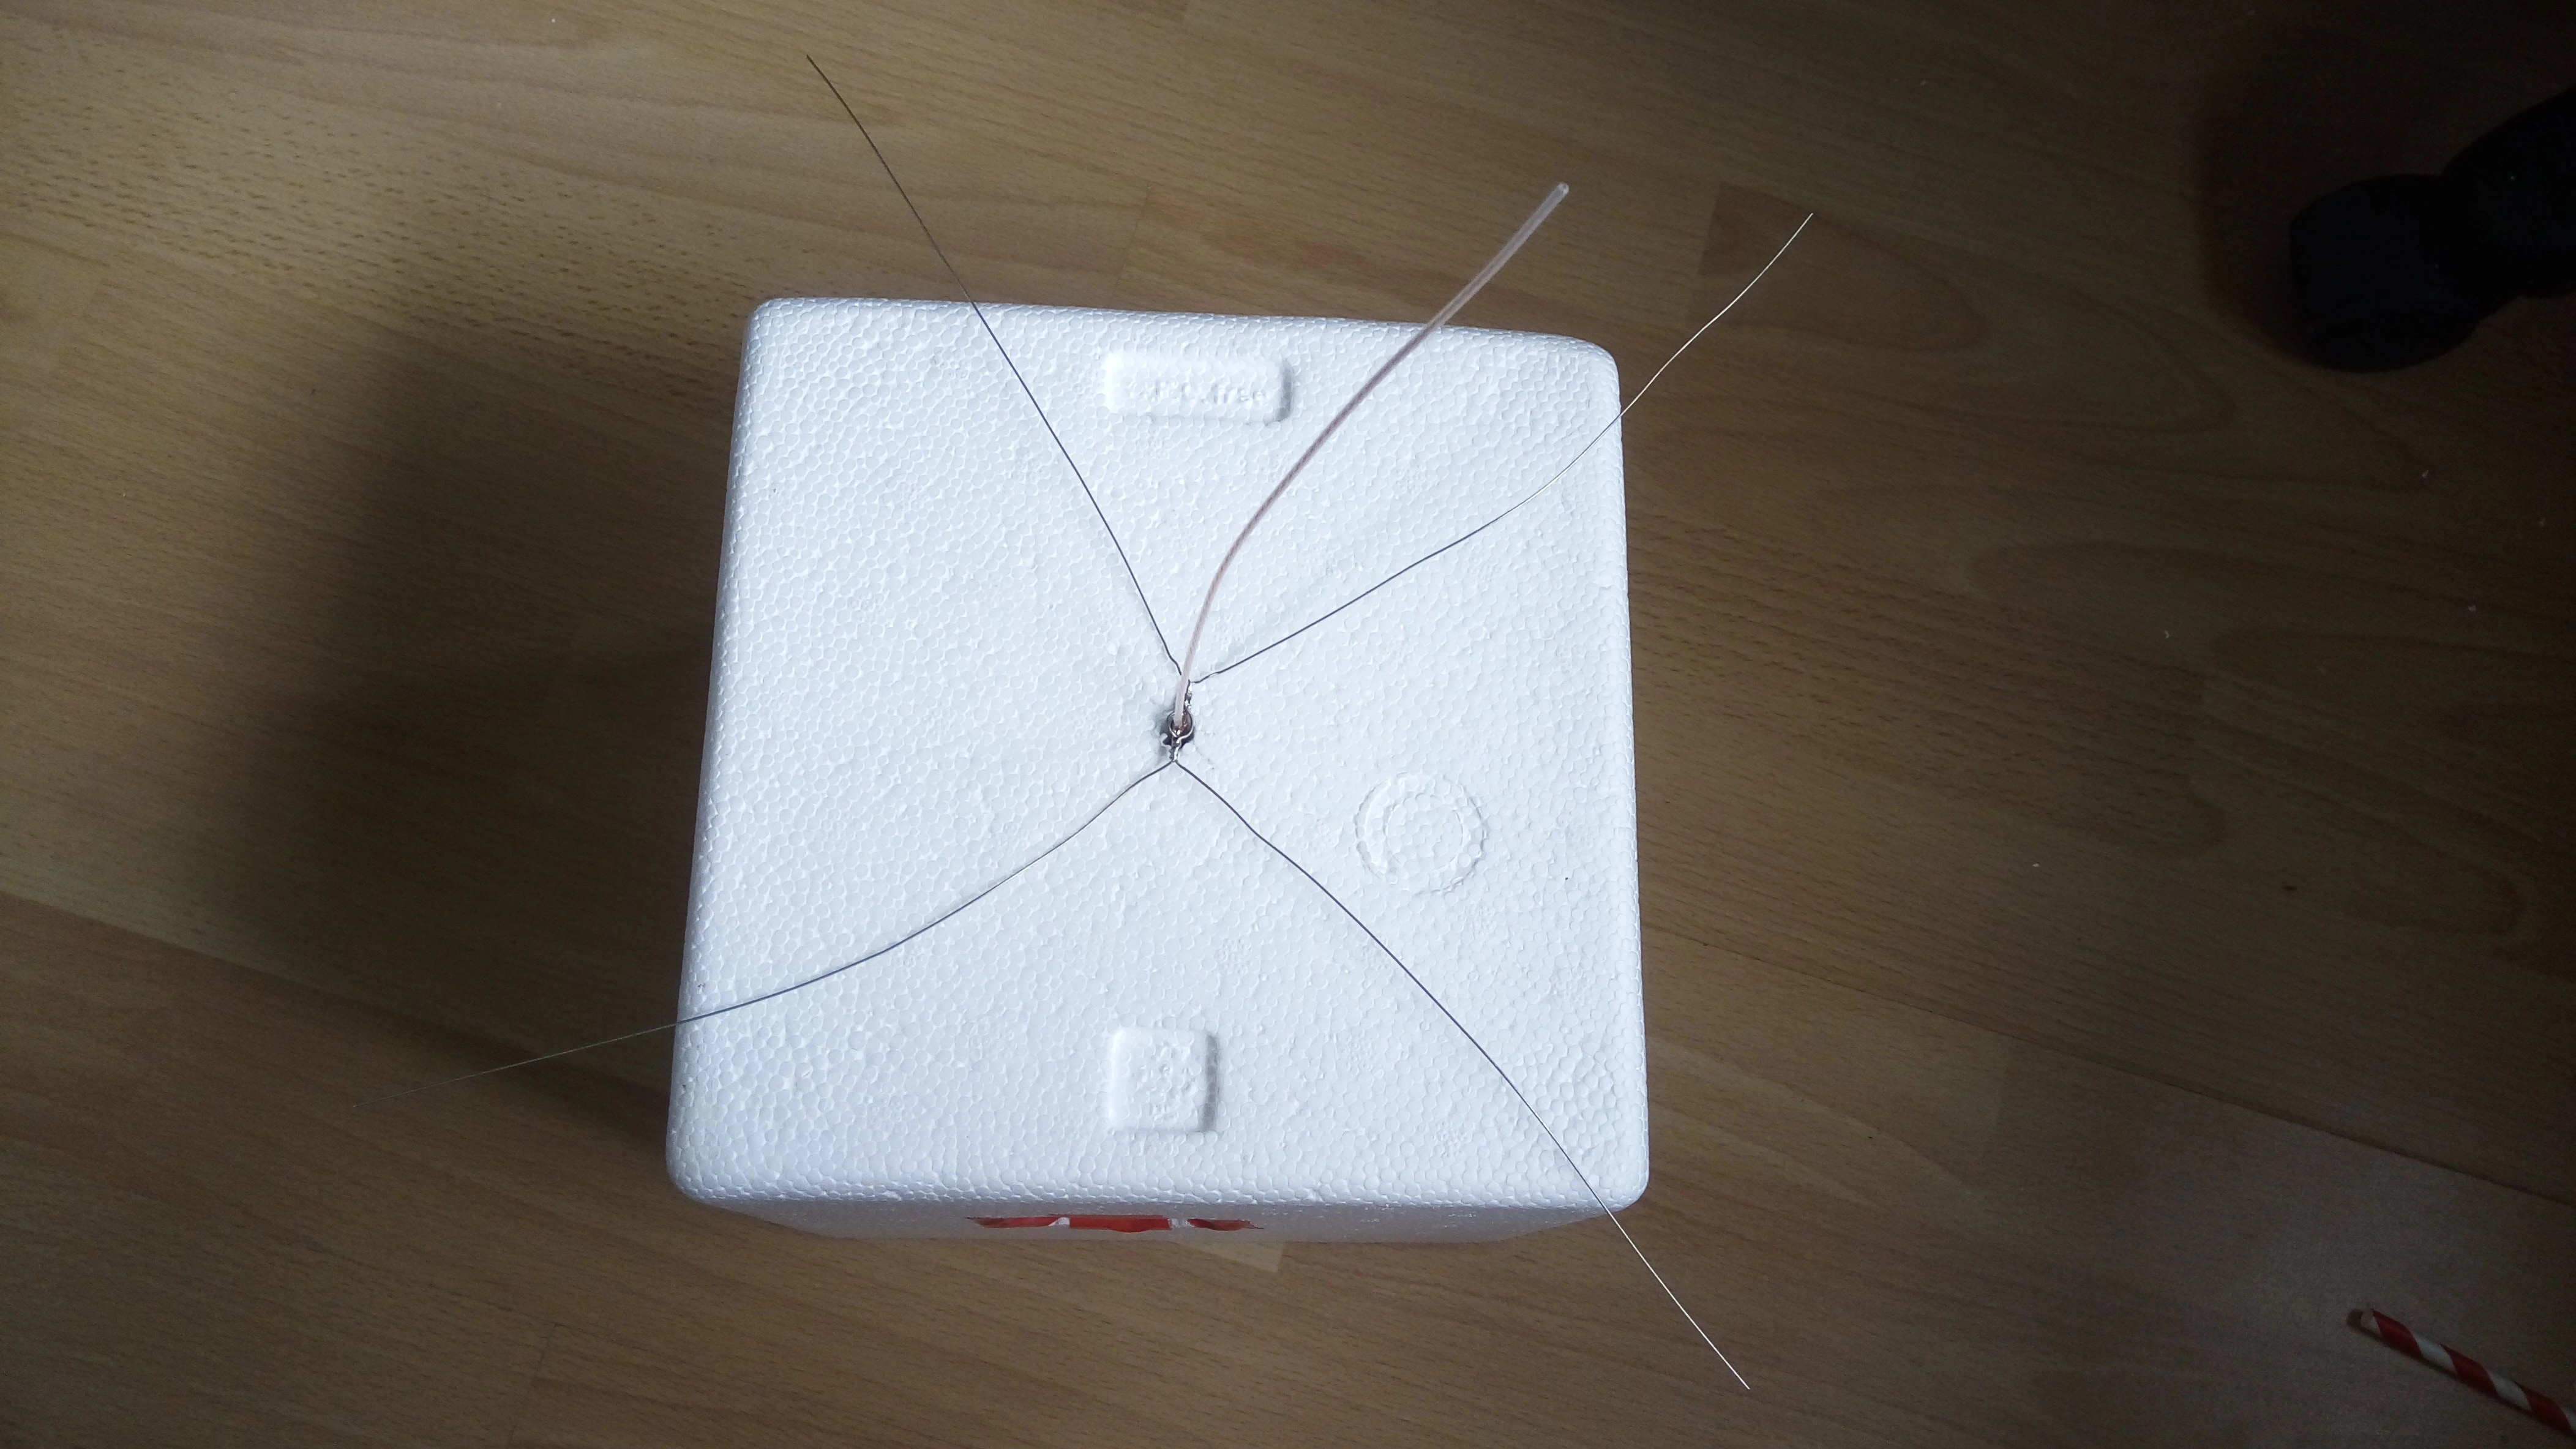
Antenna Construction

The radio obviously required an antenna to transmit properly. I constructed a 1/4 wave monopole antenna using a piece of coaxial cable, following a set of instructions from the UK high altitude society. I stripped back the outer covering, and the sheathing, so that the centre conductor had a length of around 170mm (1/4 of the wavelength of 434MHz). The stumps of the sheath were then soldered to four wires forming a makeshift ground plane. The whole contraption was held inside straws to keep the elements straight, and attached to the bottom of the payload. Buying an antenna would likely have yielded better results, but this whole project was on a budget, and I got good results from this homemade one, so I went with it!
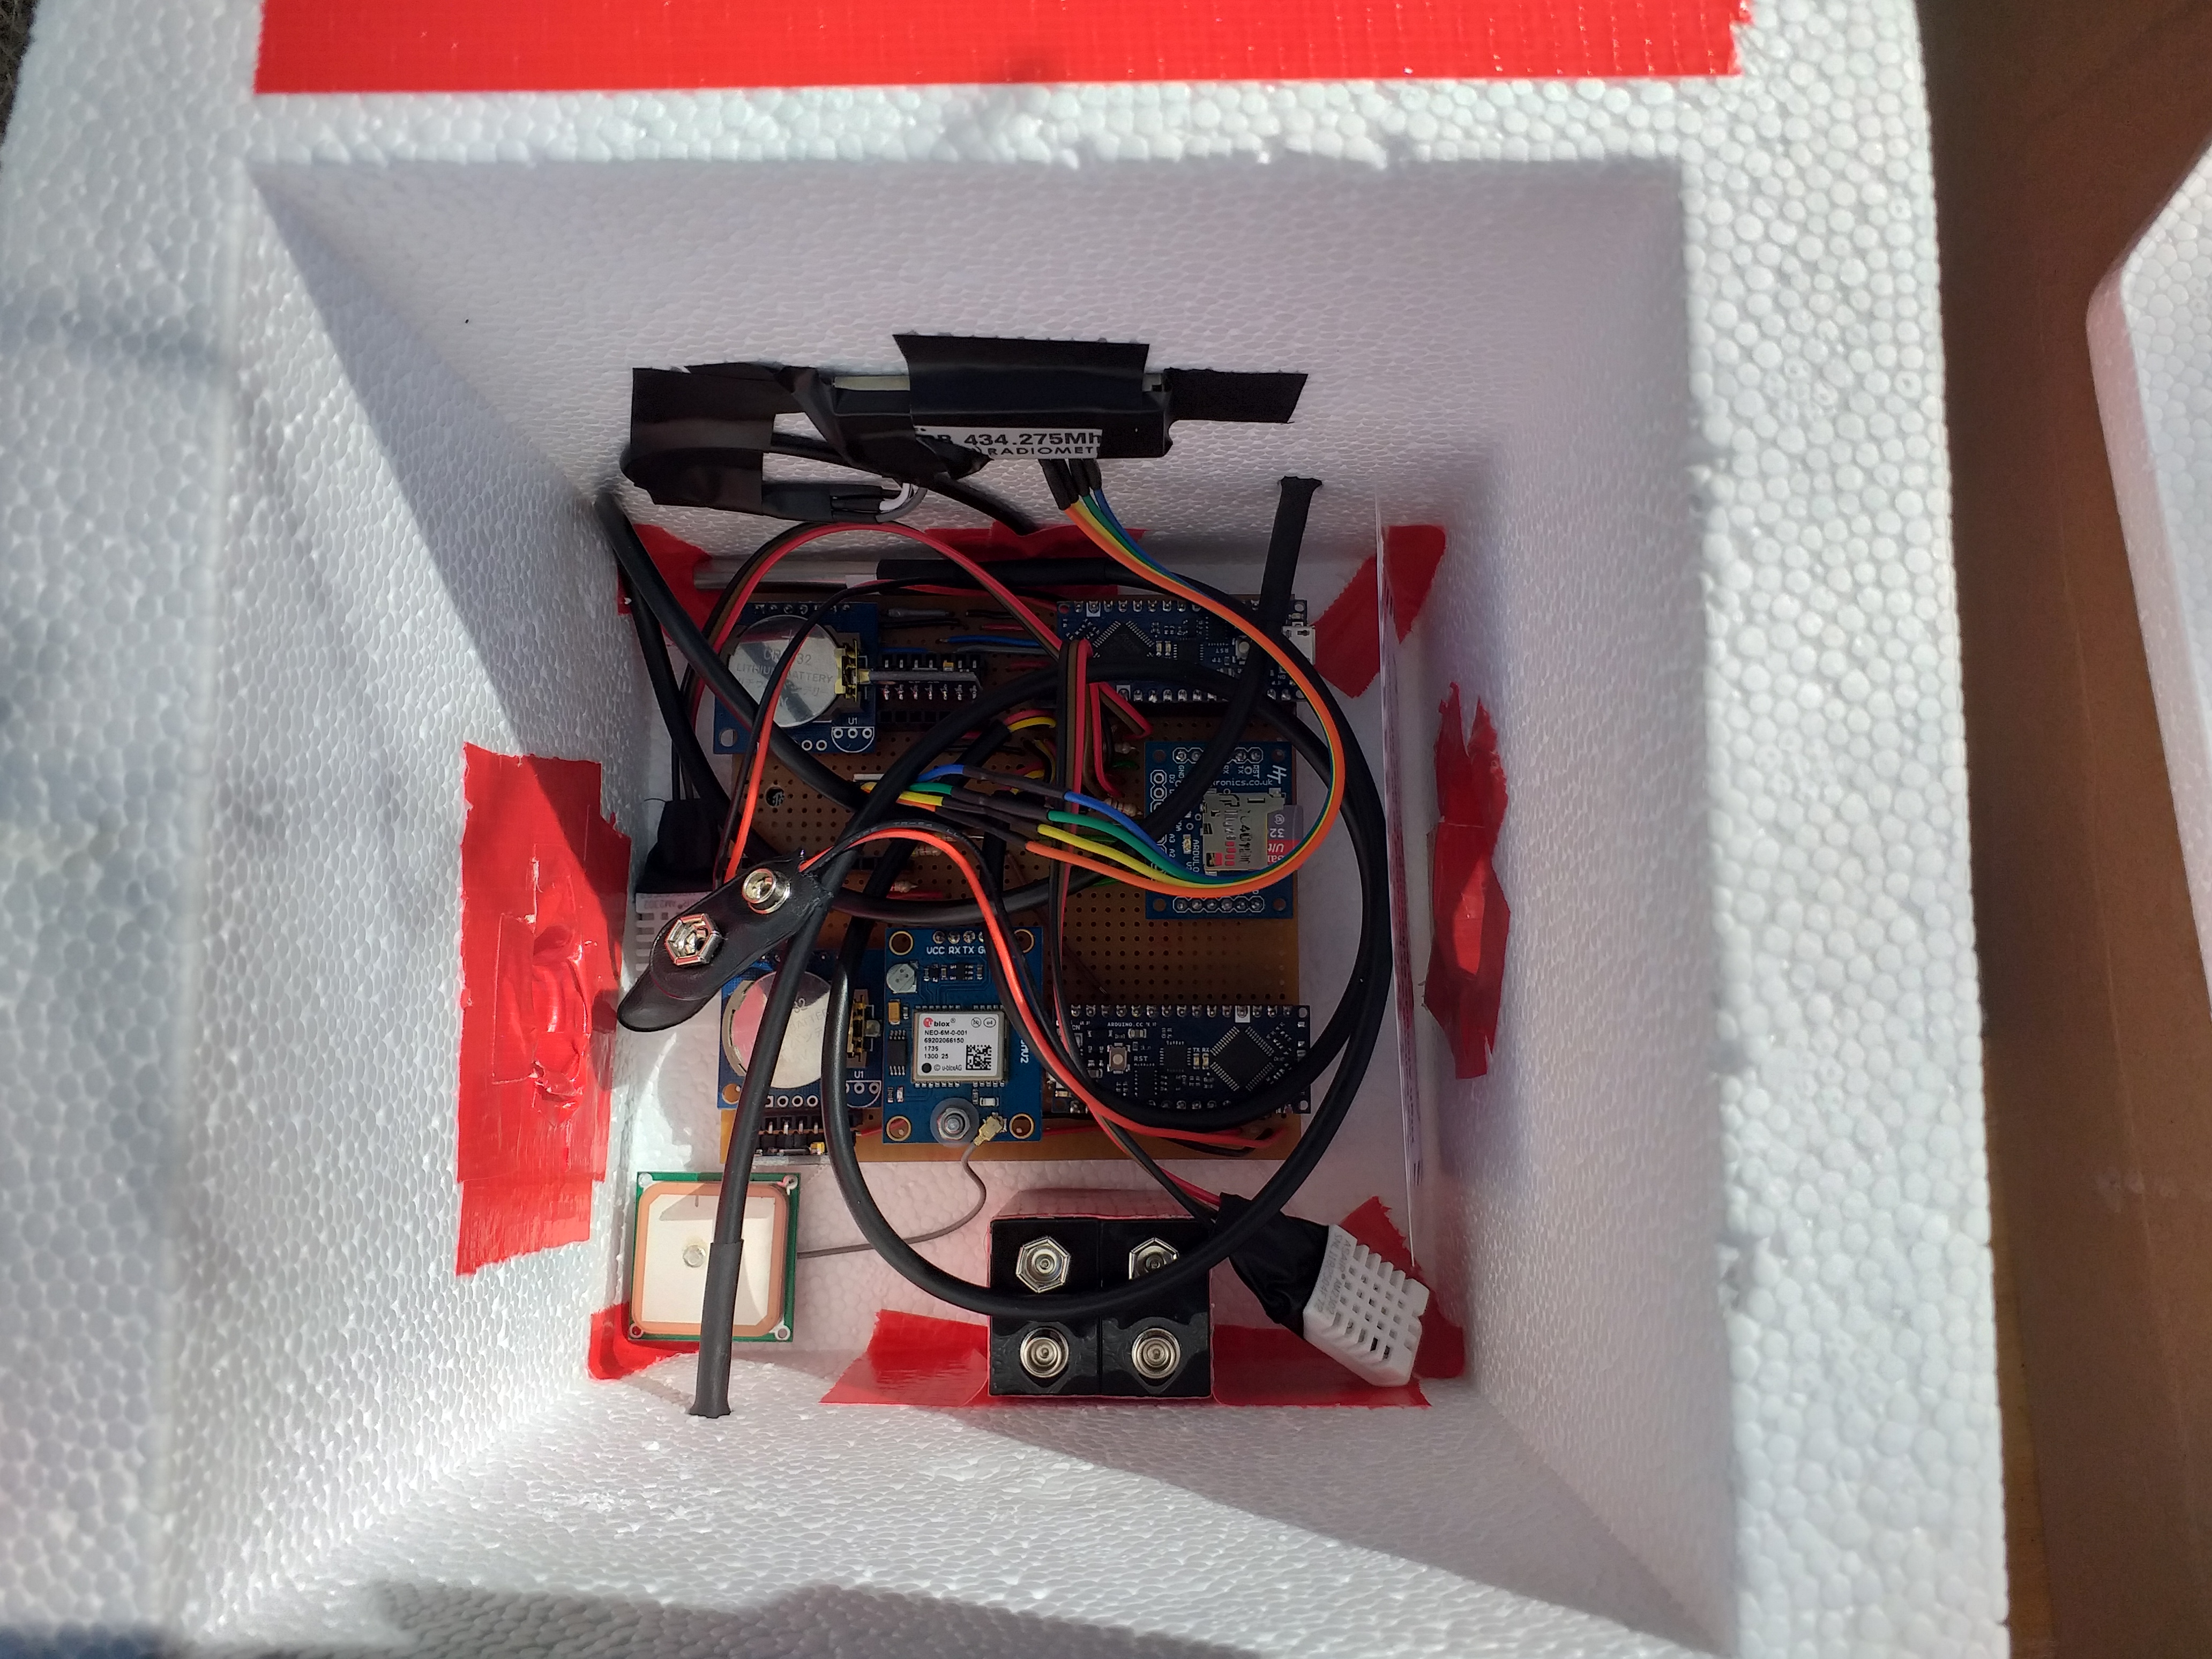
Payload Assembly
The payload itself was a polystyrene box, with a removable lid. I used polystyrene as it would be effective at insulating the inside of the payload from the cold temperatures that it would be subjected to. Temperatures can reach as low as -50°C during the flight! I cut holes in the sides for the Canon camera and the GoPro. A lot of duct tape was used on the payload, to seal up cut areas, and attach things.
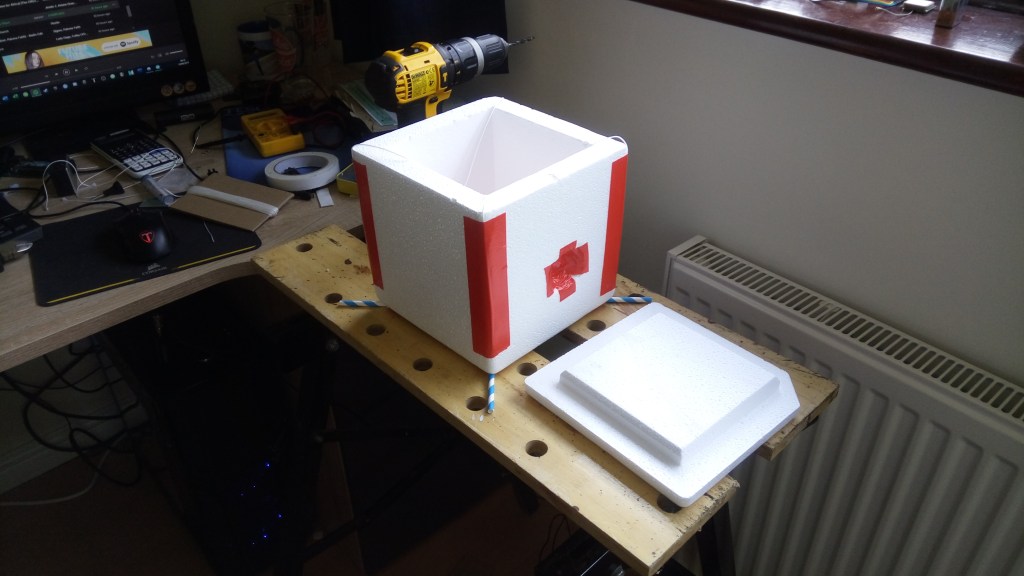

Two 9V lithium batteries from Energizer were used to power the flight data recorder and the tracker for the duration of the flight. This type of battery is advised due to its resilience against low temperatures. The two DS18B20 temperature sensors were poked out of the sides of the payload to measure the exterior temperature. I also included a laminated note on the outside of the payload, to inform anyone who found it that it was harmless, and to contact me.
Launch!
I had been in contact with Steve Randall of Random Engineering throughout this project. He, and the others on the UKHAS forum helped me a lot. I had organised to launch the balloon from Steve’s launch site near Cambridge, as this would simplify the legal hoops to jump through for the launch to be allowed to happen. Usually I would have to apply for permission for a given launch site and date from the Civil Aviation Authority (CAA), but Steve already had a permit for the site, so would only have to raise a NOTAM (Notice to Airmen) a couple days ahead of the launch.

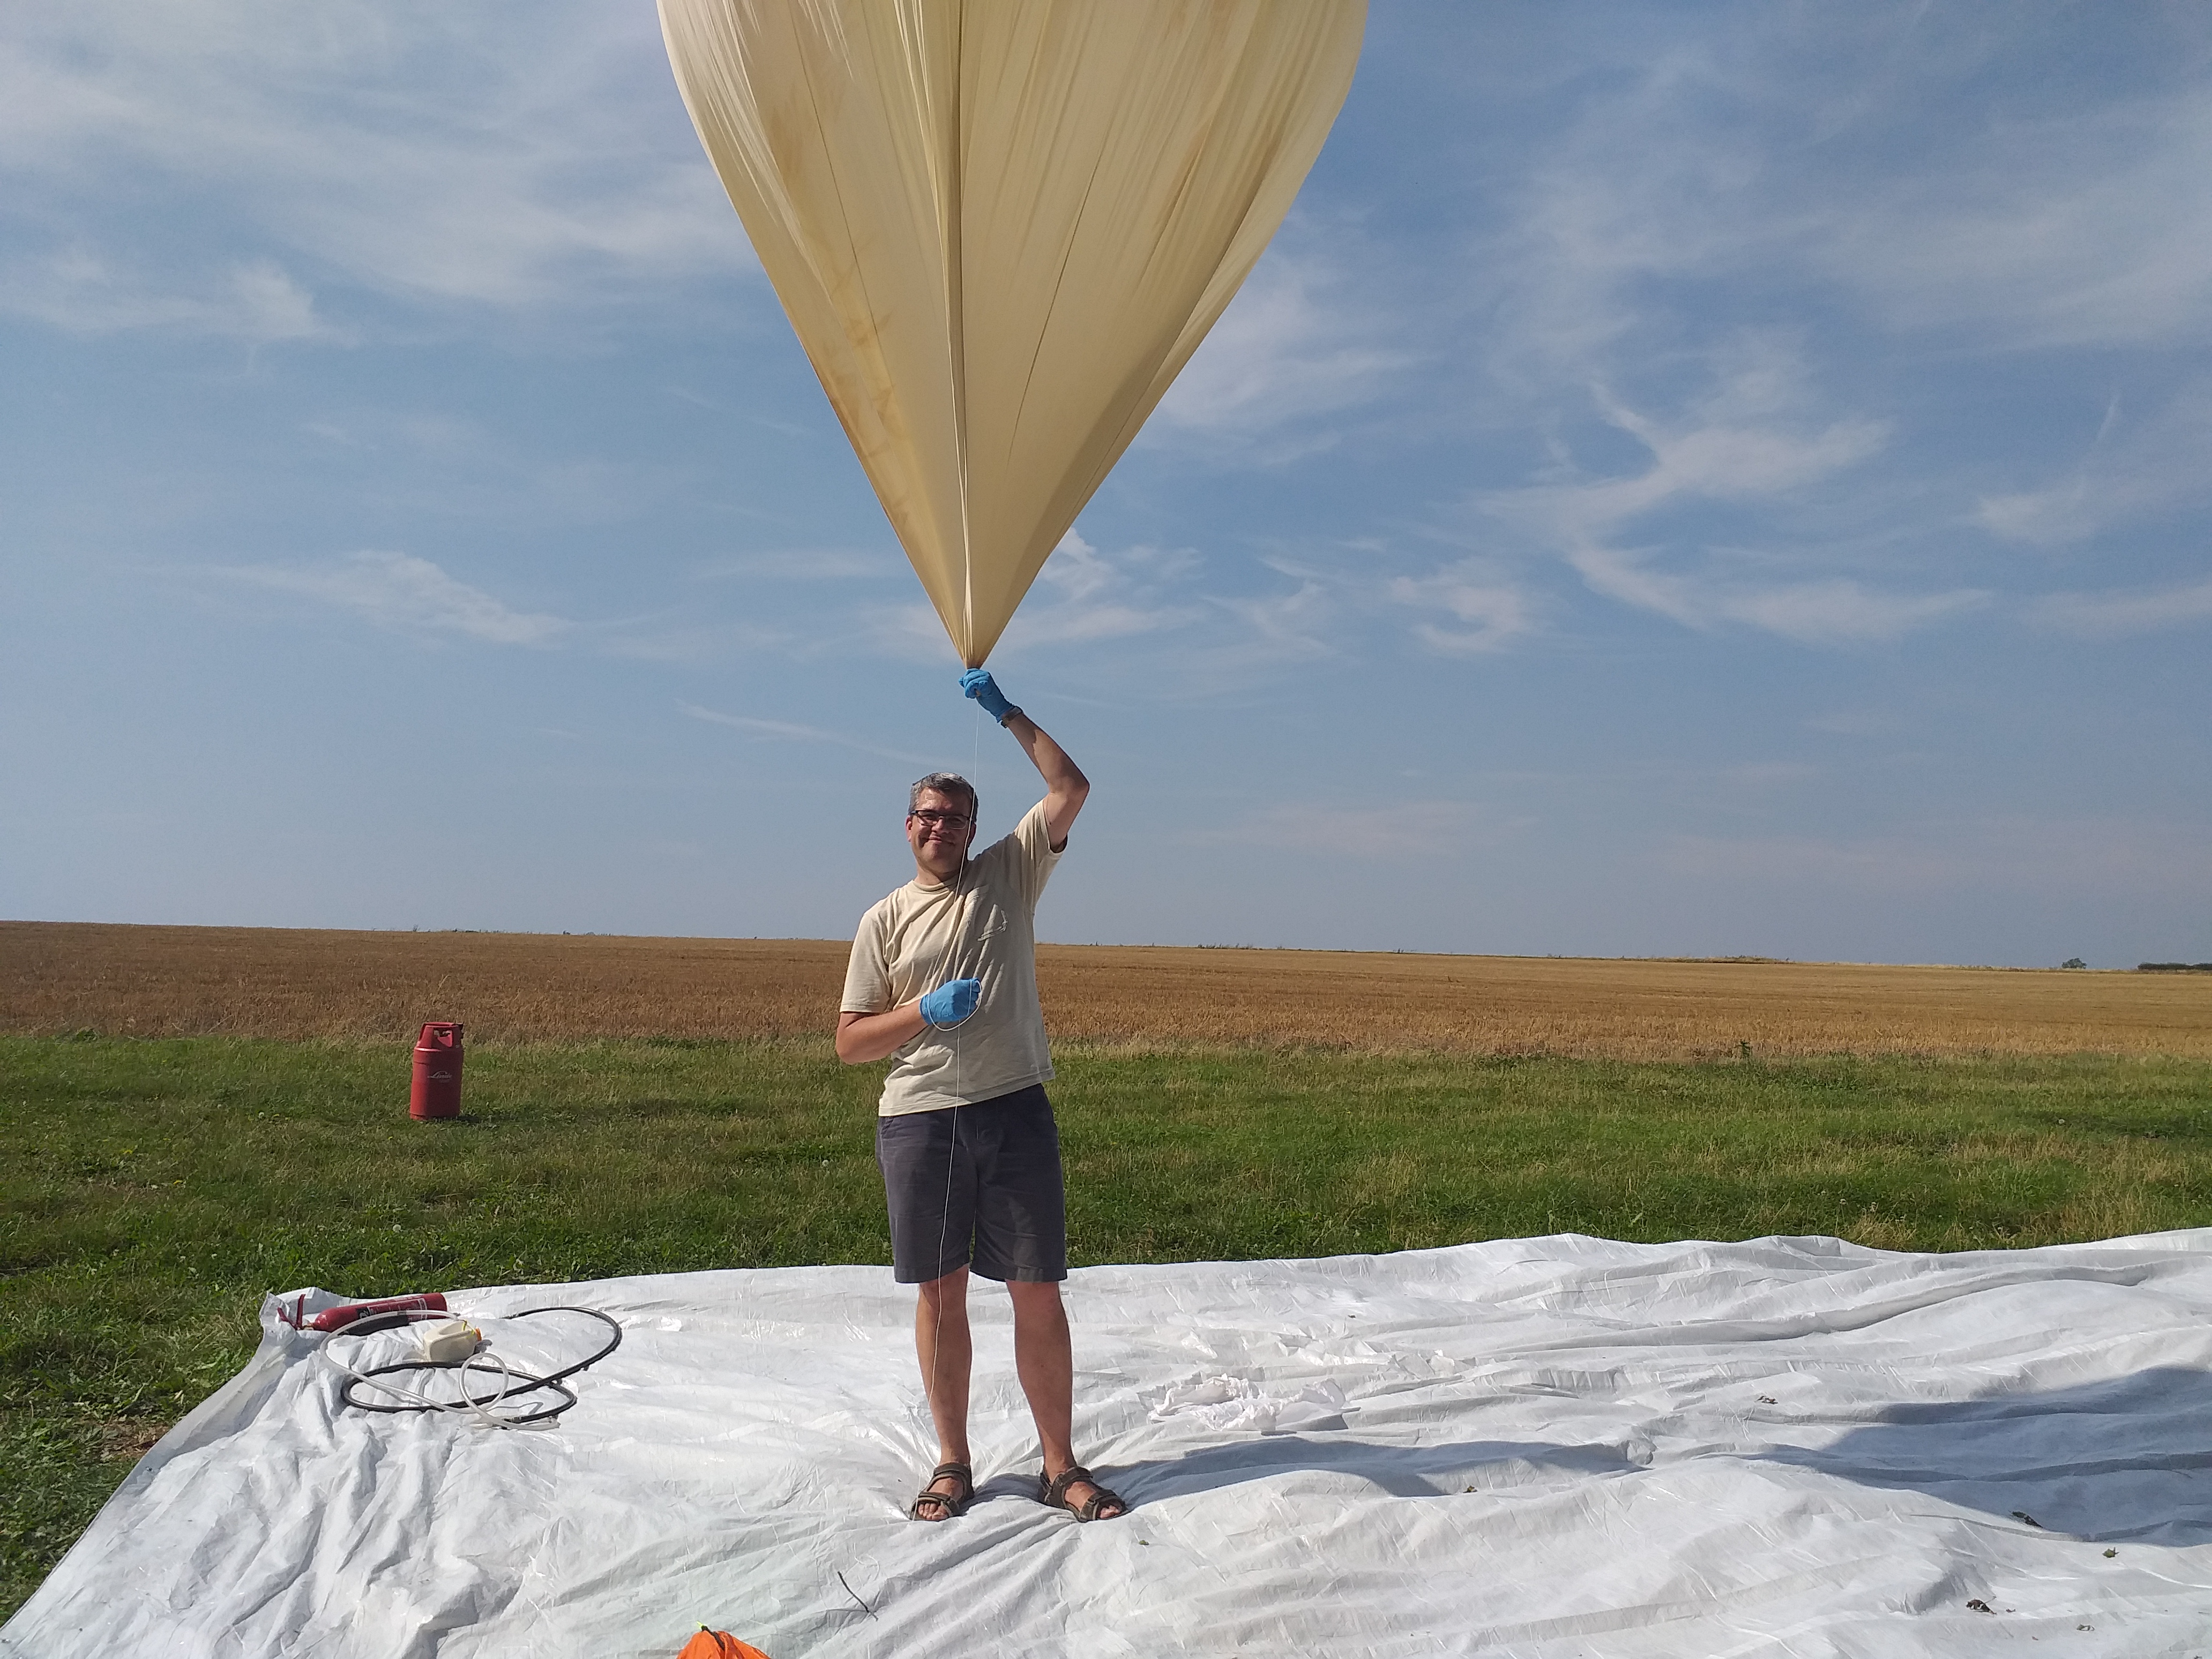
I arrived at the launch site on the morning of Saturday 24th August 2019, ready to go. I spent some time rigging the payload – attaching cords between the payload, and the parachute. I bought a Rocketman 3ft parachute to use for this flight. The balloon would be tied to the top of the parachute, and the payload to the bottom, forcing it to remain closed during the ascent, then slow the descent of the payload after the balloon burst.
We then inflated the Hwoyee-1600 balloon that I was using with hydrogen gas. Usually, weather balloons use helium due to the danger of hydrogen, but given that Steve was onsite, and helping to fill the balloon, we felt that we could go for the hydrogen, which is much cheaper than helium. Once the balloon was filled, we attached more cord between the top of the parachute and the balloon, and launched!
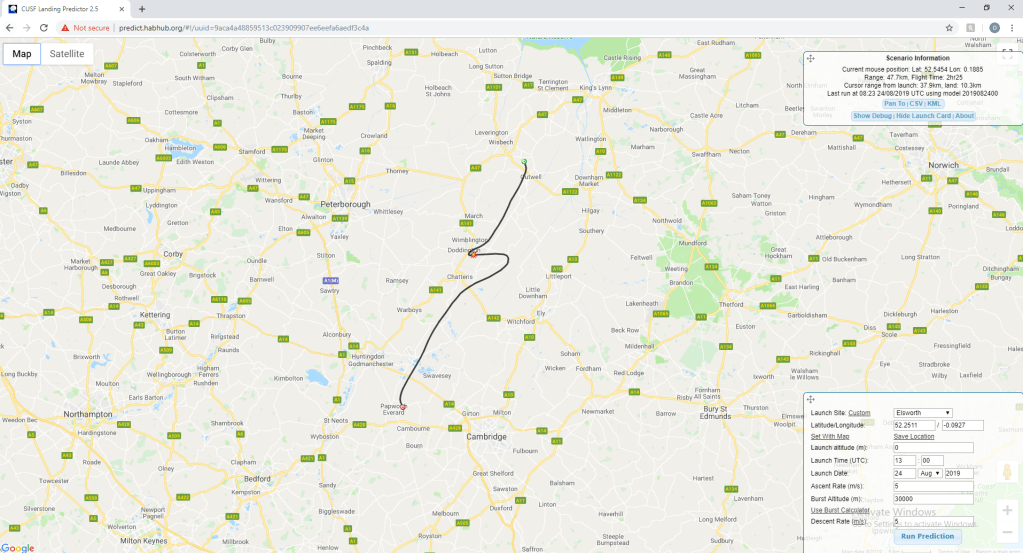
With the balloon ascending, and rapidly getting too small to see with the naked eye, we got in the car, and started driving in the general direction of the flight path prediction. A few days before we had launched, we had used a weather balloon flight predictor to predict the flight path and landing location of the balloon. Obviously we wouldn’t launch if the predictor said that the balloon would likely land in the sea, or in a major city. However, the predictions were fine for the launch day, so we went for it.
I was able to receive the signal from the radio tracker using a magnetic 3/4 wave whip antenna that I had mounted to the top of the car. We followed the balloon north, and eventually it burst, indicated by a sudden decrease in reported altitude over the tracker. It descended fairly quickly from here, and once it neared the ground, I lost signal from the radio tracker. We drove as close as we could get to it’s last known location, which took us to the entrance to Coldham Windfarm, just north of March. We spoke to someone over an intercom by a gate, and convinced them to let us in to search for the remains of the balloon. I then used a Yagi antenna that Steve had lent me, to try and find the signal from the radio. Eventually, after some driving around, and me waving the antenna around, I picked up a faint radio signal. I listened in for a bit, and eventually successfully decoded a set of coordinates! The final resting place of the balloon!
The final reported coordinates of the tracker were 52.59037, 0.14021. This was in the middle of a recently-harvested field, which was surrounded by wind turbines. We headed over to the location, and I tried to look for the payload. Fortunately, since the field was recently-harvested, I was able to spot it. I’m sure I would have found it if the field was full of crops, as it was quite far in. The final landing location was only about 7km away from the predicted landing location!
After carrying the payload back to the car, I opened it up, to examine the data and photos! Looking at the footage from the GoPro, I quickly realised that I had captured some incredible images:
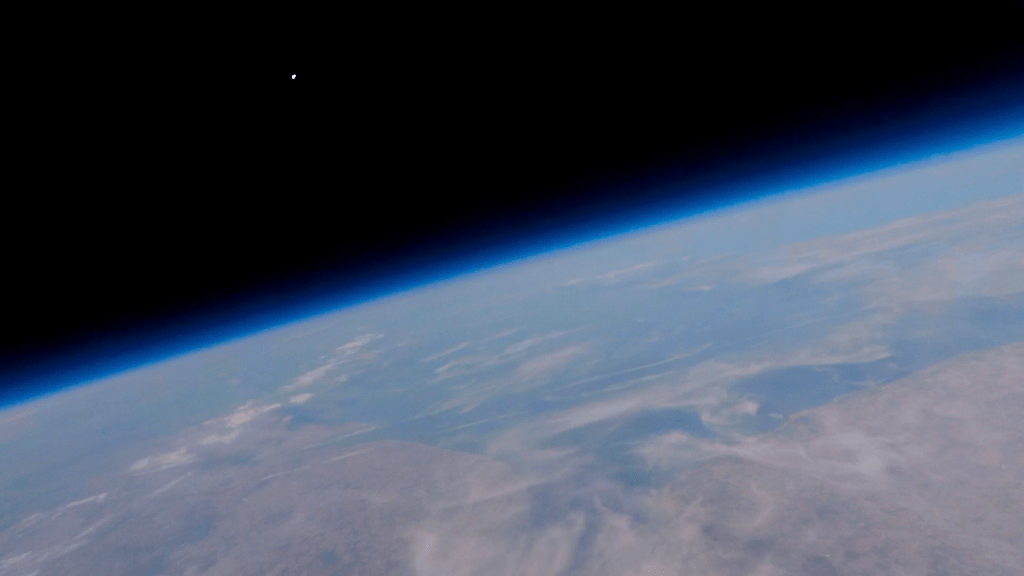
Here you can make out the blob of East Anglia on the right, the east coast on the left, and the Wash right in the middle!
You can watch some of the video from the GoPro here, including the burst of the balloon!
Unfortunately the pictures from the Canon camera were not that great, and it ran out of battery before the balloon reached it’s maximum altitude. The flight data recorder worked well, and all the sensors gathered data about the environmental conditions throughout the flight.
Data Analysis
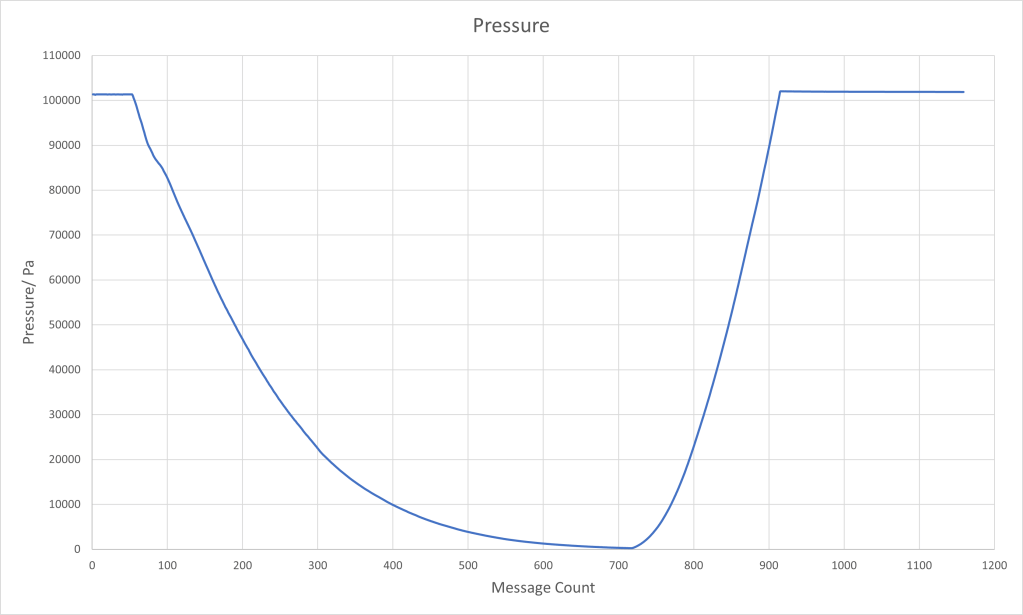
The pressure data is pretty much what I had expected – an exponential decrease in pressure as the balloon ascended. The minimum pressure was 226 millibars, at message number 720. This means that the balloon burst after just under two hours of ascent (accounting for the time where the logging was happening before the launch actually happened).
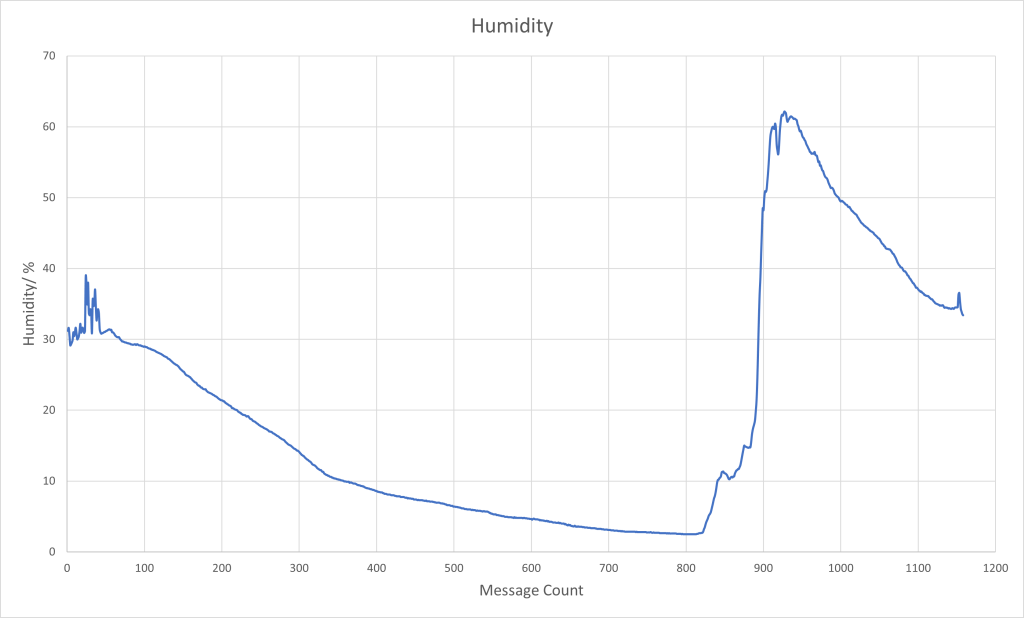
The humidity data is also fairly predictable. The humidity decreases throughout the the ascent, likely due to the thinning of the atmosphere. It rapid increases as the balloon nears the ground, reaching a maximum value just after the balloon landed. The humidity then slowly decreases after this. I think that what probably happened was as the sensor rapidly warmed up, as it entered warm air, water condensed on the sensor, which lingered, causing high humidity readings. Eventually this water evaporated.
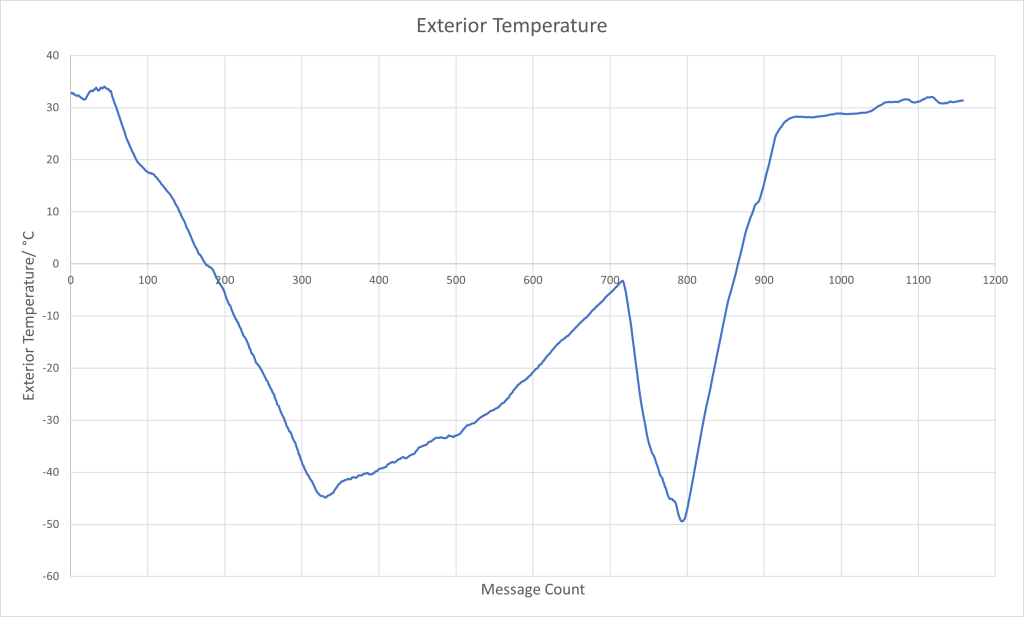
The temperature graph is probably the most interesting, as to many people, its shape is rather unexpected. The temperature starts of by decreasing as the balloon ascends. Makes sense right? Then, once the temperature reaches an initial minimum value of -45°C, it starts increasing! Huh? This continues until the balloon bursts, upon which the same thing happens in reverse – the temperature now starts decreasing as the payload falls to earth, until it reaches a minimum of -50°C, and then the temperature begins to increase again, until it settles at the ambient temperature of around 30°C.
This is actually what is supposed to happen. The temperature of the atmosphere reaches a minimum at the tropopause, the barrier between the troposphere and the stratosphere. Then, in the stratosphere, temperature increases with altitude, as the high concentration of ozone molecules present absorb ultraviolet light from the sun, and heat up.
After the fun part of the project was done, I then had to spend the next few days writing up a rather lengthy report to submit for my EPQ. Despite this, I reflected on the project, feeling proud that I had managed to do what I had set out to do almost a year earlier. Writing this webpage three years later, I am very pleased that I chose to do this. It really kickstarted my passion for electronics and engineering, and I don’t think I’d be where I am today without it!
